Last verified: August 3, 2026
TradingView can look crowded the first time you open a chart. The platform combines charting, market data, screeners, alerts, community ideas, paper trading, and broker connections in one interface. This guide focuses on the small set of tools a beginner needs first, so you can build a useful workspace without filling the screen with unnecessary indicators.
Important: TradingView is an analysis and charting platform. It does not make a strategy profitable, and the presence of an indicator or community idea is not a recommendation to trade. Market data availability, delay, and exchange fees can vary by symbol and region.
What TradingView Does
TradingView is a browser, desktop, and mobile platform for viewing financial charts and researching markets. Its Supercharts workspace can display price data, indicators, drawings, alerts, watchlists, financial information, and connected trading tools. The available markets include stocks, forex, cryptocurrencies, futures, indices, bonds, and other instruments, although the exact data and trading access depend on the exchange, selected symbol, broker, and jurisdiction.
| Charts | Compare symbols, timeframes, chart types, indicators, and drawing tools. |
| Research | Use screeners, watchlists, calendars, financial data, news, and community ideas. |
| Monitoring | Create price and technical alerts instead of watching a chart continuously. |
| Practice | Use TradingView Paper Trading with simulated funds and no deposit. |
| Execution | Connect a supported broker where available. TradingView itself is not the broker for most users. |
A free Basic account is enough to learn the interface. Paid plans mainly increase limits, remove advertisements, and unlock more chart, alert, historical-data, and workflow features. You can compare the current limits in our TradingView pricing guide.
Set Up Your First TradingView Chart
1. Open Supercharts
Open TradingView and select Supercharts. The center of the workspace contains the chart. The top toolbar controls the symbol, timeframe, chart type, indicators, alerts, and layout. Drawing tools are on the left, while watchlists and other panels usually open from the right.
2. Search for the correct symbol
Select the current ticker in the upper-left area and search for the asset you want to study. Do not choose a result based only on its ticker. The same ticker or currency pair may appear through several exchanges, brokers, or data providers.
Check the exchange and instrument type before opening the chart. For example, a stock listed on NASDAQ, a CFD that follows that stock, and a synthetic or broker-provided symbol can have different sessions, prices, and data conditions.
3. Confirm the data status
Some markets are available in real time, while others may be delayed or require an additional exchange data subscription. A paid TradingView plan does not automatically include every professional exchange feed. Check the symbol and data status instead of assuming that every chart is live.
Choose a Timeframe and Chart Type
The timeframe controls how much trading activity each bar represents. A daily chart creates one bar per trading day; a one-hour chart creates one bar per hour. Start with a timeframe that matches the decision you are studying rather than switching constantly between very short intervals.
- Daily and weekly: useful for learning broader trends and reducing short-term noise.
- Four-hour and one-hour: useful for more detailed swing analysis where the market supports those intervals.
- Very short intervals: produce more noise and require a stronger understanding of spreads, liquidity, and execution.
Candlesticks are a practical starting point because each candle shows the open, high, low, and close. Line charts can make the broad direction easier to see. TradingView also offers bars, area charts, Heikin Ashi, Renko, and other chart types, with some intraday or advanced types depending on the plan.
Add Indicators Without Cluttering the Chart
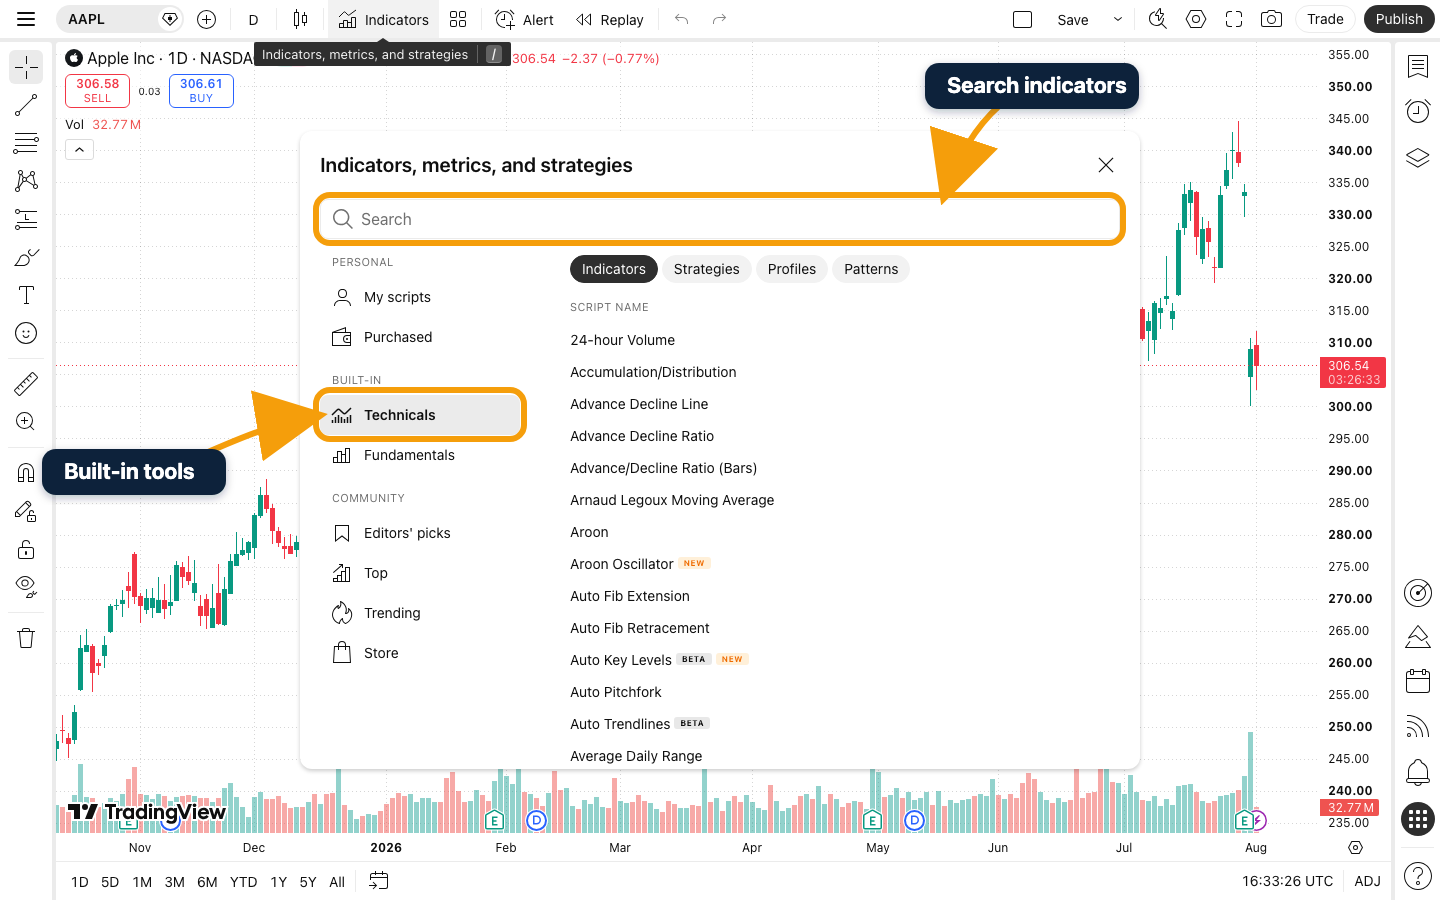
Select Indicators from the top toolbar and search for a built-in indicator. TradingView distinguishes built-in tools, community scripts, and protected or invite-only scripts. Beginners should start with well-documented built-in indicators before relying on an unfamiliar community script.
A simple learning layout could contain:
- One moving average to make trend direction easier to observe.
- Volume to compare activity between periods where reliable volume data is available.
- RSI as an example of a momentum oscillator, without treating 70 or 30 as automatic trade instructions.
Indicators transform historical or current data; they do not know what price will do next. Test each tool separately and understand its calculation before combining several signals. Our upcoming beginner TradingView indicators guide will include a clean three-indicator workspace.
Mark Levels With Drawing Tools
The left toolbar contains trend lines, horizontal lines, Fibonacci and Gann tools, geometric shapes, measurements, notes, and other annotations. For a first chart, focus on only two:
- Horizontal line: marks a price area you want to monitor.
- Trend line: connects selected points to visualize direction or structure.
Support and resistance are usually better treated as areas than as exact prices. Avoid forcing a line to fit a preferred conclusion. TradingView drawings help organize analysis, but they do not create objective evidence by themselves.
Create Alerts Instead of Watching Constantly
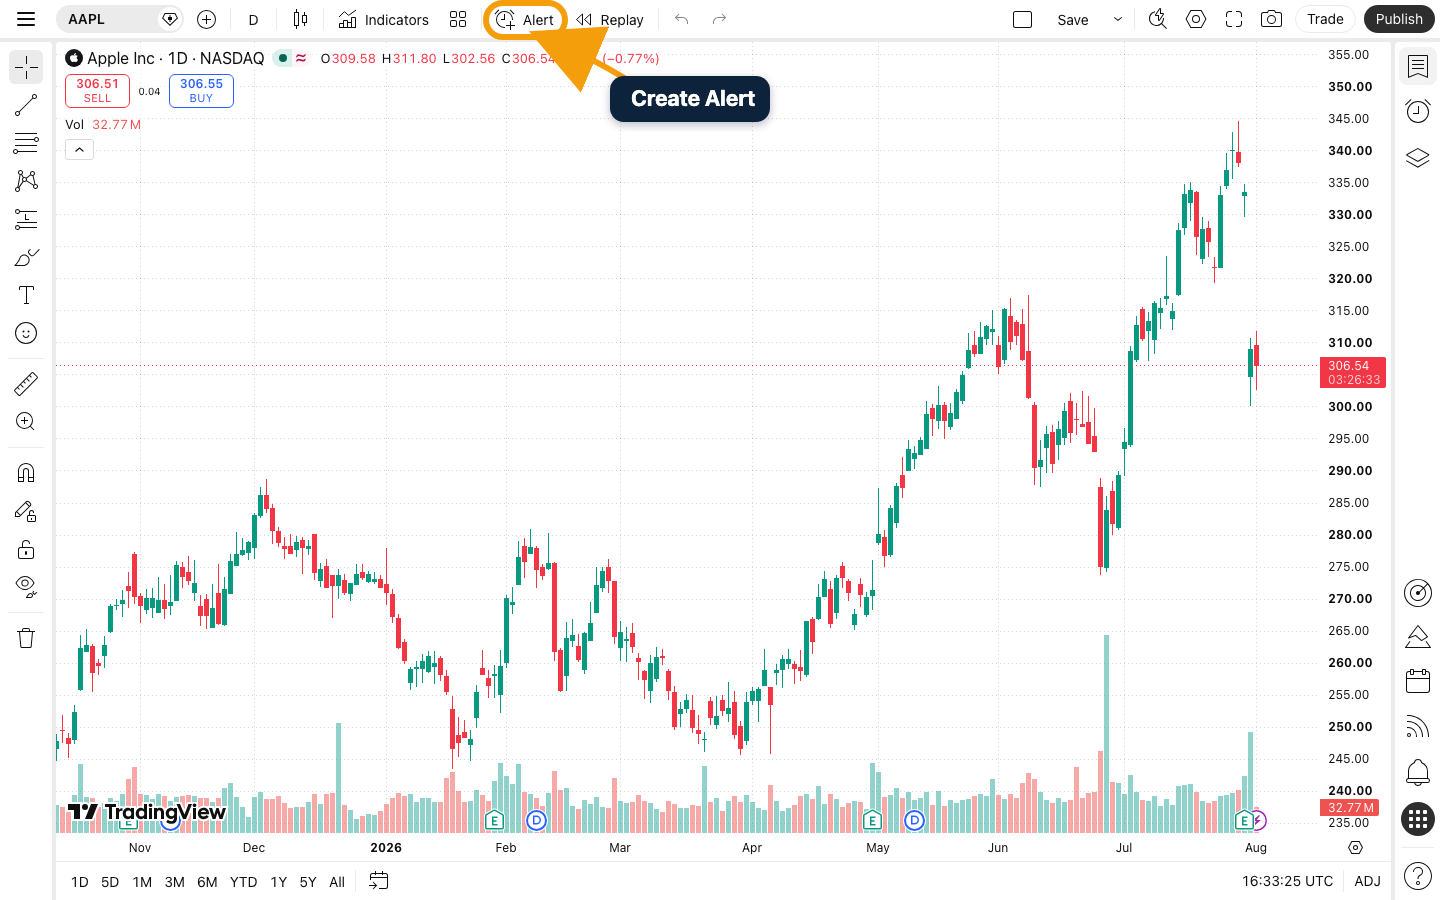
TradingView alerts can monitor price series, indicator conditions, strategies, and supported drawing objects. You can create an alert from the top toolbar, the alert manager, a chart context menu, the price scale, or the keyboard shortcut Alt + A on Windows and Option + A on macOS.
Check five settings before saving an alert:
- Symbol and condition: confirm the correct market, value, indicator, or drawing.
- Timeframe: technical alerts may depend on the selected interval.
- Trigger frequency: decide whether it should fire once, every time, or after a bar closes.
- Expiration: choose a date or an open-ended setting when your plan supports it.
- Notification: choose app, pop-up, email, sound, plain text, or webhook options where available.
If you change an indicator’s settings after creating its alert, the existing alert can continue using the old settings. Recreate or edit the alert when the underlying setup changes. See the full walkthrough in How to set alerts on TradingView.
Practise With TradingView Paper Trading
Paper Trading is TradingView’s simulated trading environment. It uses virtual funds, requires no deposit, and can be used to practise order placement and test an analysis process without risking real money.
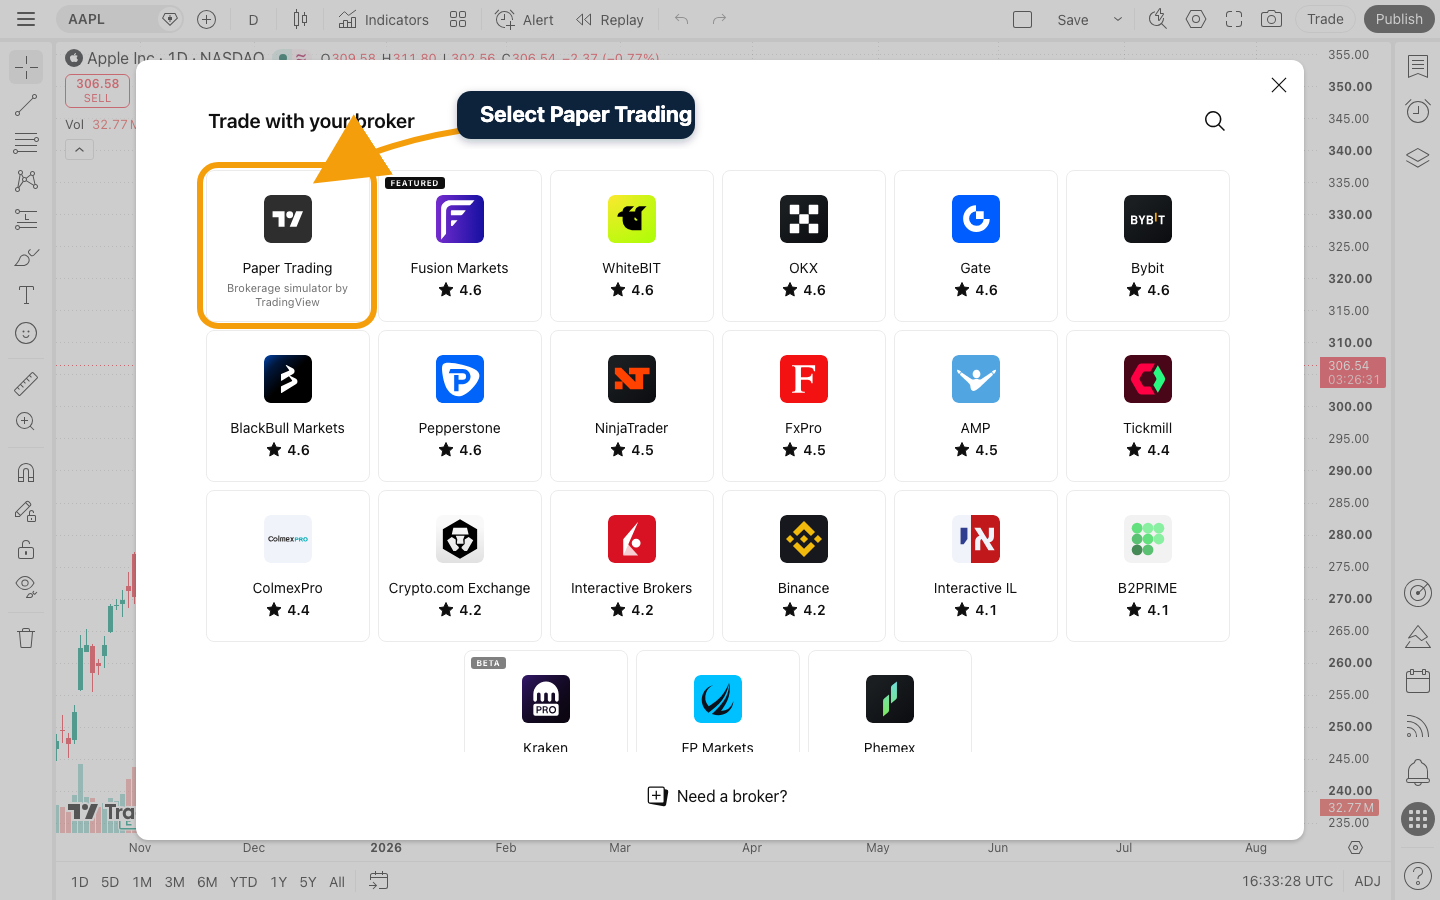
From Supercharts, open the trading controls, choose Paper Trading, and connect the simulated account. You can then place simulated orders through an order ticket or supported chart-trading controls. The simulator tracks orders, positions, and performance.
Paper results are not proof that a strategy will work with real money. Simulated trading cannot reproduce every execution condition, fee, tax, liquidity constraint, or emotional decision. Use it to learn the platform and record a repeatable process, not to manufacture an impressive virtual return.
Read the detailed setup and limitations in our TradingView Paper Trading guide.
Save a Clean Workspace
A TradingView layout contains charts and their settings, indicators, and drawings. Watchlists and alerts are managed separately rather than being stored inside a layout. Name layouts clearly, enable autosave when appropriate, and avoid opening the same layout in several tabs while making conflicting changes.
Keep the first layout simple:
- One chart.
- One selected market and data source.
- One or two indicators you understand.
- A small watchlist.
- A few purposeful alerts.
TradingView Free vs Paid for Beginners
The Basic plan currently includes one chart per tab, two indicators per chart, one saved layout, and three active price alerts. It is usually enough to learn symbol selection, chart navigation, drawings, watchlists, and paper trading.
A paid plan becomes more relevant when a real workflow repeatedly reaches a limit. Examples include needing more indicators on one chart, more simultaneous charts, more alerts, additional historical bars, custom intervals, fewer advertisements, or advanced alert and backtesting features.
| Situation | Practical starting point |
|---|---|
| Learning charts and paper trading | Start with Basic. |
| Want an ad-free layout and modestly higher limits | Compare Essential. |
| Need several charts or many alerts | Compare Plus and Premium. |
| Need the highest limits, tick data, or professional use | Review Ultimate and the applicable professional-data rules. |
Explore TradingView Compare TradingView Plans
Common TradingView Beginner Mistakes
- Opening the wrong symbol: verify the exchange, asset type, and data source.
- Assuming all data is real time: some exchange feeds can be delayed or sold separately.
- Adding too many indicators: more signals can create more conflicts rather than more certainty.
- Copying community ideas blindly: treat ideas as research inputs, not personalized advice.
- Ignoring the alert timeframe: indicator and drawing alerts can depend on the interval.
- Confusing paper results with live performance: simulation does not reproduce every real-world cost or behavior.
- Upgrading before identifying a limitation: start free and pay only when a specific workflow requires it.
Final Checklist
- Create a free account and open Supercharts.
- Choose the correct symbol and confirm its data source.
- Select one useful timeframe and a readable chart type.
- Add no more than one or two indicators at first.
- Mark a small number of relevant price areas.
- Create one test alert and confirm its trigger settings.
- Connect Paper Trading before considering real-money execution.
- Upgrade only after a Basic-plan limit affects your workflow.
Affiliate note: We may earn a commission from qualifying TradingView purchases made through our links, at no extra cost to you.