
Tesla, Inc., the trailblazing electric vehicle and clean energy company, has consistently been at the forefront of investor discussions and market evaluations. Let’s embark on an analytical journey into Tesla stock performance and what the horizon might hold for this innovative powerhouse.
1. Tesla Stock Trajectory: A Retrospective
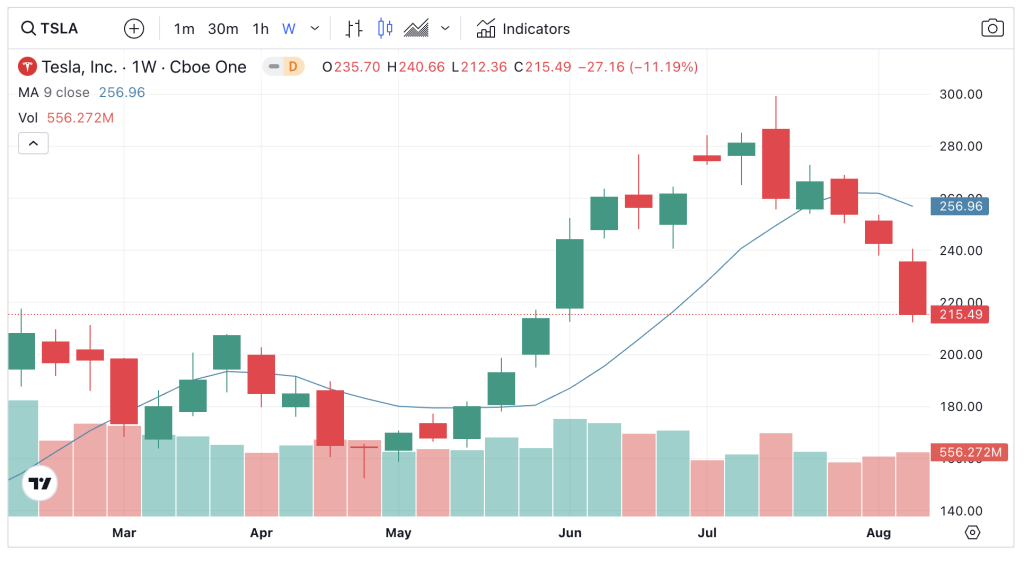
Tesla’s stock currently stands at a price of $218.775. Over the past six months, the stock has experienced remarkable fluctuations. It commenced the year at a modest $118.47, soared to an impressive high of $276.99, and settled at $215.49 towards the end of this period. The stock has witnessed a staggering volume of over 19.46 billion shares traded in the past six months.
2. Market Chronicles & Milestones
- Electric Vehicle Dominance: Tesla continues to lead the electric vehicle market, with its Model 3 and Model Y vehicles being top sellers globally. Their commitment to sustainability and innovation has solidified their position as market leaders. Source: Electrek
- Expansion into New Markets: Tesla’s foray into markets like India and its continued expansion in China signifies its global ambitions. These strategic moves are expected to bolster its global market share and revenue. Source: CNBC
3. Gazing into the Crystal Ball
Tesla’s stock trajectory is invariably influenced by its product unveilings, technological advancements, and strategic expansions. With the global shift towards sustainable energy and electric vehicles, Tesla’s innovative approach and market strategies are expected to play a pivotal role in shaping its future stock performance.
4. Epilogue
Tesla, Inc. remains a dominant force in the electric vehicle and clean energy sectors. Its stock narrative is a testament to its innovative prowess and market strategies. As the global landscape evolves, Tesla’s strategic moves will be keenly observed by investors and market analysts.
5. Advanced 50-Day MA Insights for Tesla Stock
The 50-day moving average (MA) is a pivotal tool for investors, offering a smoothed view of stock price movements over a specific period. For Tesla, the 50-day MA provides a window into its stock’s performance nuances:
- January: Tesla’s stock began the year at $118.47, reaching a high of $217.65 with an average price of $160.68.
- February: The stock opened at $204.99, peaked at $211.23, and averaged at $190.89.
- March: The stock started at $186.69, touched a high of $204.48, with an average price of $173.80.
- April: The stock initiated at $199.78, soared to a remarkable $299.29, and averaged at $254.23.
- May to Mid-August: The stock began at $279.56, reaching a high of $280.93, with an average price of $251.34.
Click here to learn more about how to use a Moving Average
From this data, it’s evident that Tesla’s stock experienced significant volatility, with the 50-day MA showcasing both bullish and bearish trends.
The stock’s ability to rebound and reach new highs, especially in April, underscores Tesla’s resilience and market confidence.
6. Conclusion
Tesla, Inc., with its groundbreaking innovations and market leadership in the electric vehicle sector, remains a focal point for investors worldwide. Its stock performance, as elucidated by the 50-day MA and other metrics, paints a picture of a company that’s not only weathering market storms but also setting the pace for the future of sustainable transportation.
As the world continues its shift towards clean energy and sustainable solutions, Tesla’s strategic moves, product launches, and market strategies will undoubtedly play a crucial role in shaping its stock narrative and overall market valuation.
Disclaimer: This article is for informational purposes only and does not constitute financial advice. Always conduct thorough research and consult with a financial advisor before making any investment decisions.
