
Moving Average
In the stock market, a moving average is a widely used technical analysis tool that helps investors identify the general trend of a stock’s price over a given time period.

Moving averages are calculated by taking the average of a certain number of past stock prices and then plotting that average on a chart.
This can help investors see the overall direction of the stock’s price and identify potential buying or selling opportunities.
In this article we will explain how to use the simple Moving Average type.
Moving Average Types
Simple Moving Average – calculated by taking the average of a set of data over a given time period. This type of moving average is easy to calculate and understand, but it can be less responsive to changes in the data.
Exponential Moving Average – gives more weight to recent data and is therefore more responsive to changes in the data. This makes it a good choice for identifying trends and making predictions.
Weighted Moving Averages – which assign different weights to different data points in the time period being averaged. This allows for even greater customization and can be useful in certain circumstances.
Use Moving Average In The Stock Market
To use a moving average in the stock market, you first need to decide on a time period for the moving average. Common time periods for moving averages in stock market analysis include 50-200 days.
Once you have chosen a time period, you can then calculate the moving average for a stock by taking the average of its closing prices over that time period.
For example, let’s say you want to calculate a 50-day moving average for a stock. You would first need to gather the closing prices for the stock over the last 50 days.
Next, you would add up all of these prices and divide the total by 50 to calculate the moving average. This average would then be plotted on a chart along with the stock’s actual price over time.
— Click Here To Use Moving Average Tool —
How does it help us?
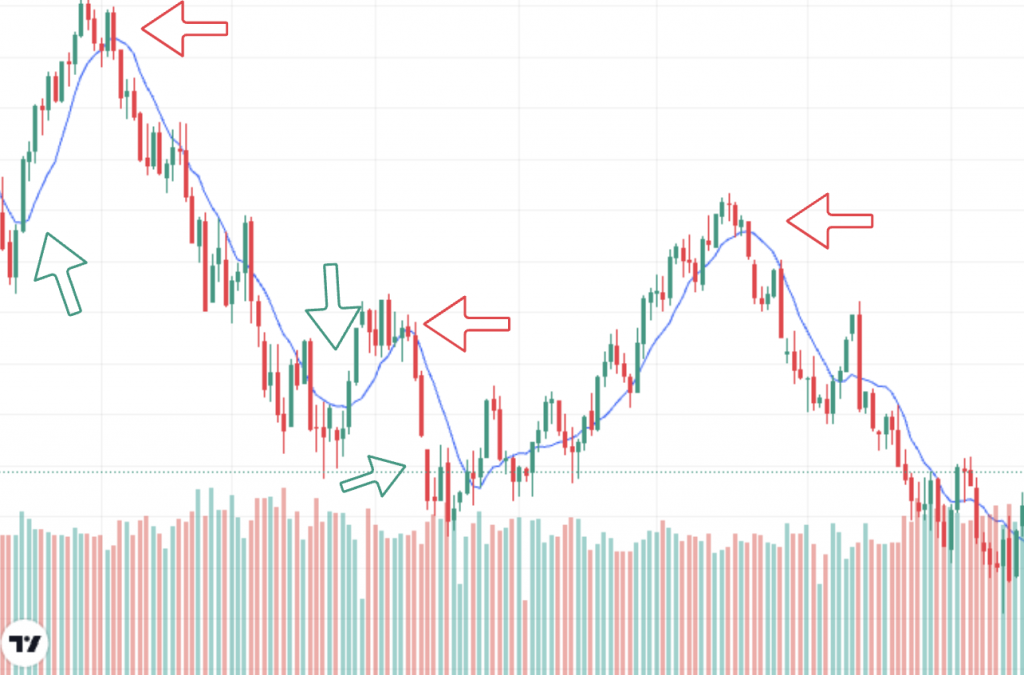
By looking at the moving average line on the Invesco QQQ Trust chart, we can get a sense of the overall direction of the stock’s price. If the moving average line is rising, it indicates that the stock’s price is generally increasing over time.
If the moving average line is falling, it indicates that the stock’s price is generally decreasing over time.
Buy Or Sell?
Investors can use moving averages to help make decisions about when to buy or sell a stock.
For example, if a stock’s price is consistently above its moving average line, it may be a good time to buy the stock.
On the other hand, if a stock’s price is consistently below its moving average line, it may be a good time to sell the stock.
Summary
The Moving Average will show you the general change of the stock price against his average price over time, however, using only one technical tool analysis cannot always help you determine whether a trend will continue or not.
It is recommended combining this information with other technical analysis tools as well as fundamental analysis of the stock market, and that will help you to make a proper decision.
Are you using Moving Average? did you found this article useful? do you have any questions?
Stay tuned and share your opinion by commenting below.

Thank you so much for sharing this informative post on moving averages! I have always struggled with understanding this concept, but your clear and concise explanation has helped me to finally grasp it. Your breakdown of the different types of moving averages and the examples provided were especially helpful. I am grateful for the time and effort you put into writing this post, and I know it will be a valuable resource for me as I continue to learn and grow in my financial analysis skills. Thank you again!
Thank you Jake for your lovely comment!