
Analysis prepared October 1, 2026. Micron’s fiscal fourth quarter ended September 3, 2026; results were released September 30. All dollar amounts are U.S. dollars.
Micron Technology (NASDAQ: MU) reported $54.23 billion of fiscal Q4 2026 revenue, up 379% from a year earlier, and GAAP diluted earnings of $32.87 per share. Operating cash flow reached $43.97 billion. The results reflect an extraordinary improvement in memory pricing and demand, not just higher HBM shipments. The central investment question is whether today’s margins and cash generation can persist as Micron expands capacity and memory supply eventually responds.
There is a calendar qualification from the start: fiscal Q4 2026 contained 14 weeks, while fiscal Q4 2025 and fiscal Q3 2026 contained 13. The reported growth rates are correct, but they do not compare equal-length periods. Micron’s fiscal 2026 had 53 weeks versus 52 in fiscal 2025. Micron Q3 FY2026 Form 10-Q; Q4 results.
Micron Q4 FY2026 earnings at a glance
| Measure | Q4 FY2026 | Q3 FY2026 | Q4 FY2025 |
|---|---|---|---|
| Revenue | $54.23B | $41.46B | $11.32B |
| GAAP gross margin | 86.8% | 84.6% | 44.7% |
| GAAP operating margin | 80.7% | 80.4% | 32.3% |
| GAAP diluted EPS | $32.87 | $24.67 | $2.83 |
| Operating cash flow | $43.97B | $25.39B | $5.73B |
| Conventional free cash flow, calculated | $32.86B | $17.56B | $0.07B |
Conventional free cash flow (FCF) is operating cash flow less gross property, plant and equipment purchases. It is our calculation, not Micron’s adjusted FCF measure. Figures are rounded for display. Source: Micron’s Q4 results and cash-flow reconciliation.
1. Profitability: pricing and mix drove the jump
Revenue increased 30.8% sequentially and 379.3% year over year. A simple revenue-per-week check reduces those comparisons to approximately 21.5% and 345.0%, respectively. That arithmetic does not produce a true comparable-week growth rate: weeks can differ in shipment timing, product mix and prices. It only shows why the extra week should not be ignored.
Micron reported $39.8 billion of DRAM revenue, up 27% sequentially. DRAM bit shipments rose in the mid-single digits, while average selling prices rose in the high teens. NAND revenue was $14.1 billion, up 42% sequentially; bits rose about 10% and prices about 30%. In other words, price was a major driver in both businesses. High-bandwidth memory is strategically important, but Micron did not disclose a separate Q4 HBM revenue dollar figure. Earnings deck, performance by technology; prepared remarks, DRAM and NAND.
GAAP gross margin reached 86.8%, up from 44.7% a year earlier. GAAP operating margin was 80.7%. Non-GAAP gross and operating margins were 87.0% and 82.3%, respectively; those are distinct adjusted measures, not substitutes for the GAAP results. The huge margin expansion demonstrates the strength of the current market, but memory pricing is cyclical. Treating this quarter’s margin as a permanent baseline would be an assumption, not a disclosed fact. Q4 results and reconciliation.
Eight-quarter operating history
USD billions except EPS and margins. FCF is calculated consistently as operating cash flow minus gross PP&E expenditures; negative FCF is shown with a minus sign. FY2026 Q4 is 14 weeks; the other quarters shown are 13 weeks.
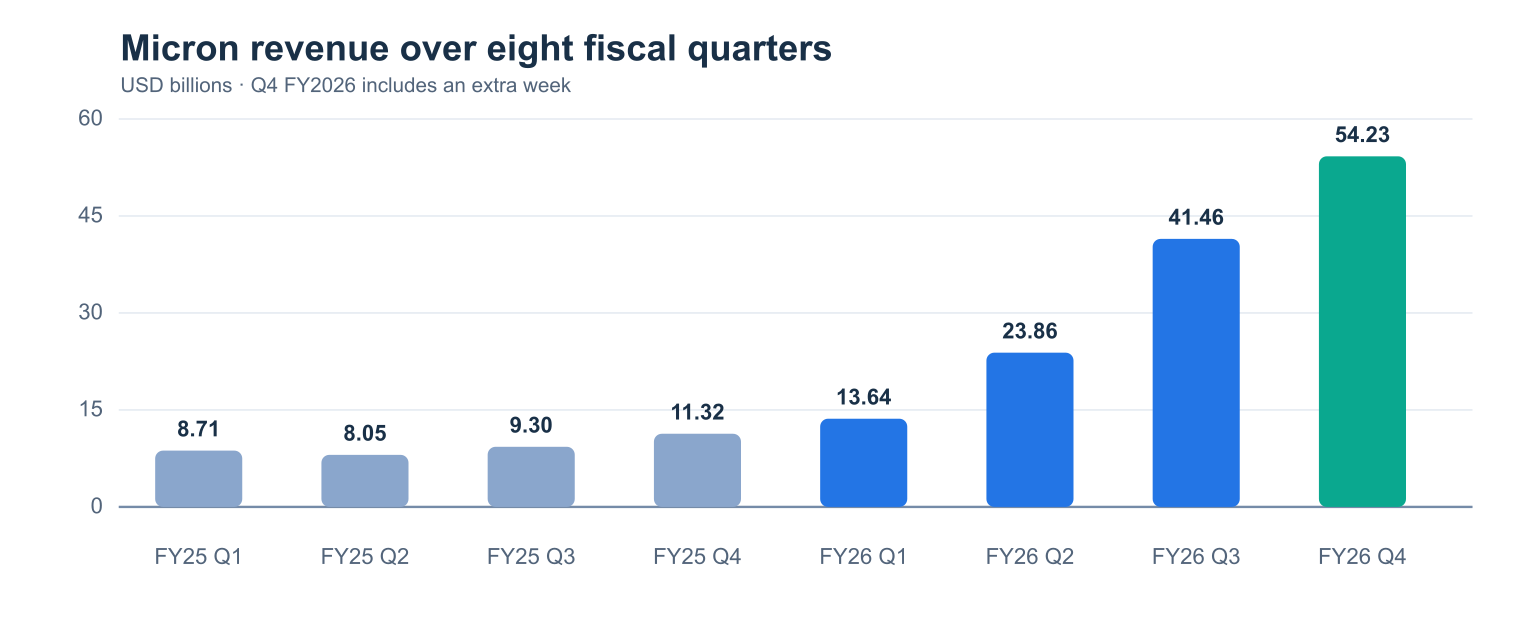
| Fiscal quarter | Revenue | GAAP gross margin | GAAP diluted EPS | Calculated FCF |
|---|---|---|---|---|
| FY2025 Q1 | $8.71B | 38.4% | $1.67 | $0.04B |
| FY2025 Q2 | $8.05B | 36.8% | $1.41 | −$0.11B |
| FY2025 Q3 | $9.30B | 37.7% | $1.68 | $1.67B |
| FY2025 Q4 | $11.32B | 44.7% | $2.83 | $0.07B |
| FY2026 Q1 | $13.64B | 56.0% | $4.60 | $3.02B |
| FY2026 Q2 | $23.86B | 74.4% | $12.07 | $5.52B |
| FY2026 Q3 | $41.46B | 84.6% | $24.67 | $17.56B |
| FY2026 Q4 | $54.23B | 86.8% | $32.87 | $32.86B |
Inputs: Micron’s FY2026 Q1, Q2, Q3 and Q4 releases, each of which provides the matched prior-year quarter and cash-flow reconciliation. This is a dramatic two-year operating change, not evidence by itself that the peak of the cycle has moved permanently.
Where revenue came from
| Business unit | Q4 FY2026 revenue | Share of total, approx. | Sequential change |
|---|---|---|---|
| Cloud Memory | $16.28B | 30% | +18% |
| Core Data Center | $18.00B | 33% | +56% |
| Mobile and Client | $13.11B | 24% | +14% |
| Automotive and Embedded | $6.82B | 13% | +47% |
The two data-center-oriented units together contributed about 63% of reported revenue. The unit labels do not permit us to equate that entire amount with AI revenue or HBM. Core Data Center gross margin reached 90%; Cloud Memory gross margin was 83% and flat sequentially, with management citing higher HBM mix as an offset to better pricing. Earnings release, unit results; prepared remarks.
2. Valuation: strong earnings do not settle the stock question
Micron reported FY2026 GAAP diluted EPS of $74.33, compared with $7.59 in FY2025. MU closed the first full regular trading session after the earnings release, October 1, 2026, at $1,097.39, up 3.03% from the September 30 close of $1,065.11. Both Google Finance and Yahoo Finance displayed that October 1 regular-session close at 4:00:01 p.m. EDT, separately from after-hours trading, when checked shortly after the close. Dividing that price by Micron’s reported full-year GAAP EPS gives a calculated trailing FY2026 P/E of about 14.8×. This is a historical, cycle-sensitive multiple—not a forward estimate or a valuation verdict. FY2026 annual results.
Even a precisely calculated trailing multiple would need a cyclical warning. FY2026 earnings benefited from exceptionally high pricing and margins; if those moderate, a low-looking trailing P/E could be misleading. Management’s forward guidance is one scenario, not a guaranteed earnings run rate. This review therefore does not assign a price target, intrinsic value or buy/sell call.
3. Cash flow: separate operating cash from customer financing
Micron generated $43.97 billion in Q4 operating cash flow and spent $11.11 billion on property, plant and equipment. Subtracting the latter gives $32.86 billion of conventional FCF. Micron instead reports $33.20 billion of adjusted FCF because its net-capex definition credits $327 million of government incentives and $9 million of PP&E sale proceeds. The $336 million difference is small relative to total FCF, but the definitions must not be blended. For FY2026, conventional FCF was $58.96 billion versus Micron’s $62.31 billion adjusted FCF. Q4 cash-flow statement and reconciliation.
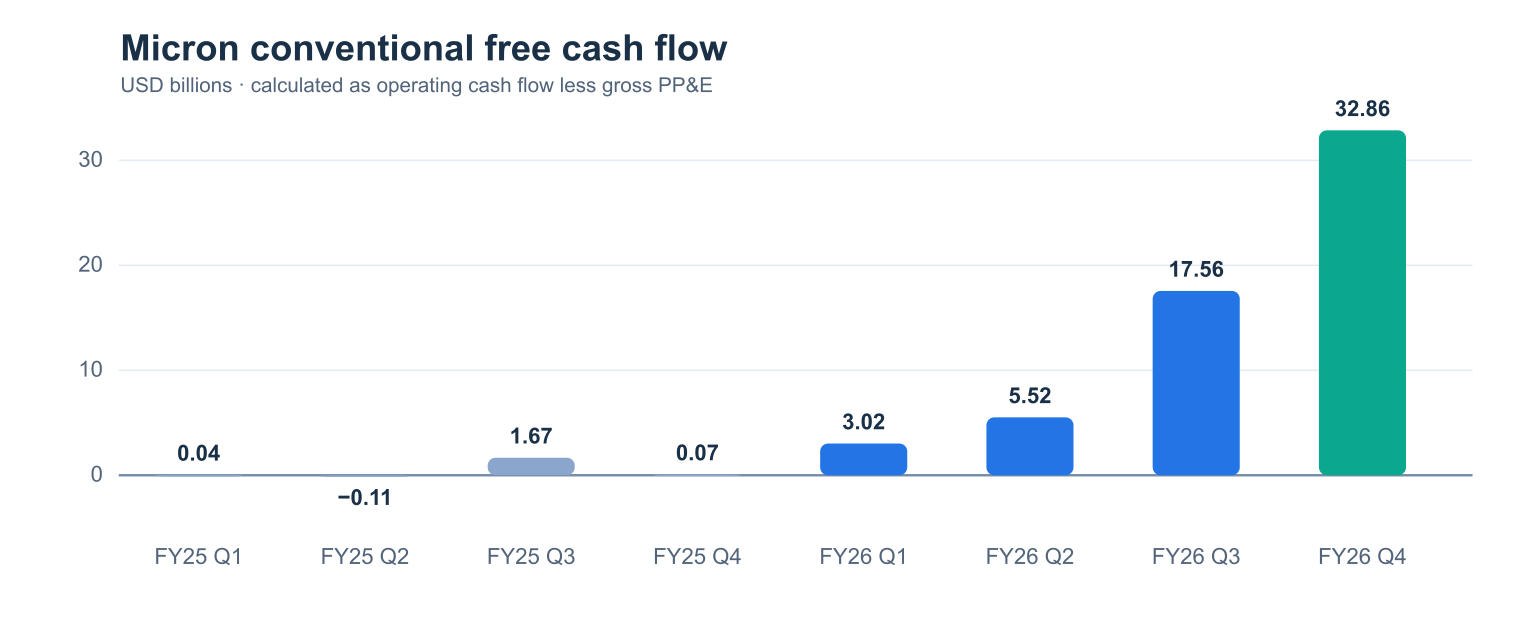
Micron also received $12.3 billion of customer cash deposits during Q4 under strategic customer agreements. Crucially, these deposits appear in financing cash flow, not operating cash flow, so they are not part of either FCF number above. They increase cash today but are associated with future obligations. Prepared remarks, cash flow and deposits; Q4 cash-flow statement.
The next cash-flow test is durability. Micron projects approximately $11.5 billion of net capex in FY2027 Q1, about $25 billion in the first half and more in the second half, with construction spending rising. Those are management projections and use net capex; actual gross PP&E purchases and incentive receipts may differ. Prepared remarks, FY2027 investment outlook.
4. Financial health: substantial liquidity with an important qualification
At September 3, Micron held $73.48 billion of cash, marketable investments and restricted cash, against $5.18 billion of current and long-term debt. That gives the company’s $68.30 billion net-cash measure. Current assets of $91.07 billion versus current liabilities of $27.48 billion imply a current ratio of roughly 3.31. These are strong balance-sheet indicators on the reported date, not a prediction of future liquidity. Q4 balance sheet; earnings deck, liquidity reconciliation.
The cash figure needs context. Management said $12.7 billion of customer SCA deposits were on the balance sheet at quarter-end. They are unrestricted, but are expected to be returned over time toward the latter half of the agreements if minimum purchase requirements are met. It would be inaccurate to treat all deposit-funded cash as unencumbered excess capital. Inventory was $10.4 billion, while days of inventory increased by nine to 129; management attributed part of the change to build-ahead and manufacturing-related incentive compensation. Prepared remarks, inventory and deposits.
5. Forward signals: contracts increase visibility, not certainty
Micron has signed 26 strategic customer agreements (SCAs). Management estimates they will represent more than 35% of revenue through 2030. About three-quarters of that estimated SCA revenue has a defined pricing framework, often with a floor and ceiling. Customer financial commitments total approximately $32 billion, the vast majority in the form of deposits. Remaining performance obligations were about $150 billion, based on qualifying agreements, committed volumes and minimum pricing. These are contract and management metrics—not recognized Q4 revenue, booked cash flow or a guarantee of future results. Prepared remarks, SCA and RPO discussion.
Micron said the vast majority of its calendar-2027 HBM bit supply is contracted and that HBM pricing in those agreements rose significantly year over year. It did not disclose enough Q4 HBM revenue detail to derive a defensible standalone HBM growth rate. Management also expects tight DRAM and NAND supply-demand conditions in 2027 and 2028. That outlook could support pricing, but the same earnings cycle is driving more construction and equipment spending; capacity additions, competitor responses and demand changes remain key risks. Prepared remarks, HBM and market outlook.
For FY2027 Q1, Micron guided to $61.5 billion revenue, plus or minus $1.5 billion; approximately 85.95% GAAP gross margin; and GAAP diluted EPS of $37.84, plus or minus $1.00. The corresponding non-GAAP margin and EPS outlook are approximately 86.25% and $38.15, plus or minus $1.00. This is guidance, not a reported result. Management expects Q1 gross margin to be the FY2027 floor, partly because manufacturing incentive compensation capitalized into Q4 inventory will flow through cost of goods sold; that expectation remains subject to execution and market conditions. Q4 company outlook; prepared remarks.
Bottom line
Micron’s Q4 confirms a profound change in its current economics: much higher memory prices, sharply improved margins and cash generation, and large multi-year customer commitments. The strongest evidence comes from the reported income and cash-flow statements, not from extrapolating an undisclosed HBM revenue number or treating customer deposits as operating cash.
The cautions are equally material: a 14-week quarter inflates headline comparisons, memory pricing can reverse, and FY2027 investment spending is set to rise. The next review should track DRAM/NAND selling prices and bit volumes, HBM supply execution, actual deposit and RPO conversion, conventional FCF after gross capex, inventory days, and whether margins hold as new capacity is built. Excellent quarterly results alone do not determine whether MU shares are attractively priced.
Micron Q4 FY2026 earnings FAQ
What were Micron’s Q4 FY2026 revenue and EPS?
Revenue was $54.23 billion, with GAAP diluted EPS of $32.87 and non-GAAP diluted EPS of $33.42. The two EPS bases should not be mixed. The earnings table and profitability analysis above show their context.
Why is the 379% revenue growth rate not a perfectly comparable figure?
It compares a 14-week quarter with a 13-week quarter. The reported rate is mathematically correct, but part of the difference reflects extra reporting time. A crude per-week calculation is only a sense check, not a like-for-like adjustment.
Did Micron include customer deposits in free cash flow?
No. SCA customer deposits are reported in financing activities, outside operating cash flow. Micron received $12.3 billion of them in Q4. The cash-flow section above separates these deposits from operating cash.
How is Micron’s adjusted FCF different from conventional FCF?
Conventional FCF here is operating cash flow minus gross PP&E spending: $32.86 billion in Q4. Micron’s $33.20 billion adjusted figure instead subtracts net capex after certain government incentives and asset-sale proceeds.
Does Micron’s FY2027 Q1 revenue guidance guarantee another record?
No. The $61.5 billion midpoint is management’s forward-looking estimate and can differ from actual results. The forward-signals section above explains what to monitor.
Continue your research
Read more in TradeProperly’s quarterly earnings analysis archive or compare how a different business model responds to growth and cash-flow pressures in our Costco Q4 FY2026 earnings analysis. For chart-based context, our TradingView review is separate from this fundamental analysis.
Methodology and disclosure
This article examines five areas: profitability, valuation, cash flow, financial health, and forward signals. It is a focused quarterly review, not an exhaustive fundamental assessment. Financial inputs come from Micron’s September 30, 2026 earnings release, earnings presentation, prepared remarks, and the earlier quarterly releases linked above. The released Q4 and full-year statements are unaudited; a FY2026 Form 10-K was not available during this drafting pass. All FCF and simple ratio calculations are identified as such. Management projections, contract estimates and historical facts are kept separate.
The October 1 closing price and one-day change above are dated to the first full post-release regular session and checked against Google Finance and Yahoo Finance; the trailing P/E is our calculation from that price and company-reported FY2026 GAAP EPS. No analyst consensus figure, live or after-hours price, price target or peer ranking has been inserted into this analysis. AI-assisted research and drafting were used with source-linked verification. This material is educational, not personalized investment advice or a recommendation to buy or sell a security.