
Analysis prepared September 29, 2026. Fiscal quarter ended August 30, 2026. Market-price snapshot: September 28 close.
Costco’s Q4 FY2026 earnings report showed $95.72 billion in total revenue, up 11.1% year over year, and reported diluted EPS of $6.75. The 16-week quarter ended August 30, 2026. Membership renewals remained high and annual free cash flow improved, but reported EPS included a one-off benefit and membership-fee growth slowed. Below, we separate the operating results from the stock’s dated valuation.
The investment question is separate from the operating result. At the September 28 closing price, Costco traded at approximately 44.46 times its FY2026 diluted earnings. Sustaining growth matters at that valuation; a strong quarter alone does not establish that the stock is attractively priced.
Costco Q4 FY2026 earnings at a glance
| Measure | Q4 FY2026 | Q4 FY2025 |
|---|---|---|
| Total revenue, including membership fees | $95.72B | $86.16B |
| Revenue growth, year over year | 11.1% | 8.1% |
| Reported diluted EPS | $6.75 | $5.87 |
| Operating margin, total-revenue basis | 3.97% | 3.88% |
| Standalone free cash flow, calculated | $2.49B | $1.90B |
Costco reported the results on September 24. Its fourth quarter covers 16 weeks, compared with 12 weeks in each of the first three quarters. Total revenue includes membership fees and should not be confused with net merchandise sales. FCF is calculated as operating cash flow minus property and equipment additions. FY2026 Q4 results; FY2025 Q4 results.
1. Profitability: Costco’s revenue and EPS growth
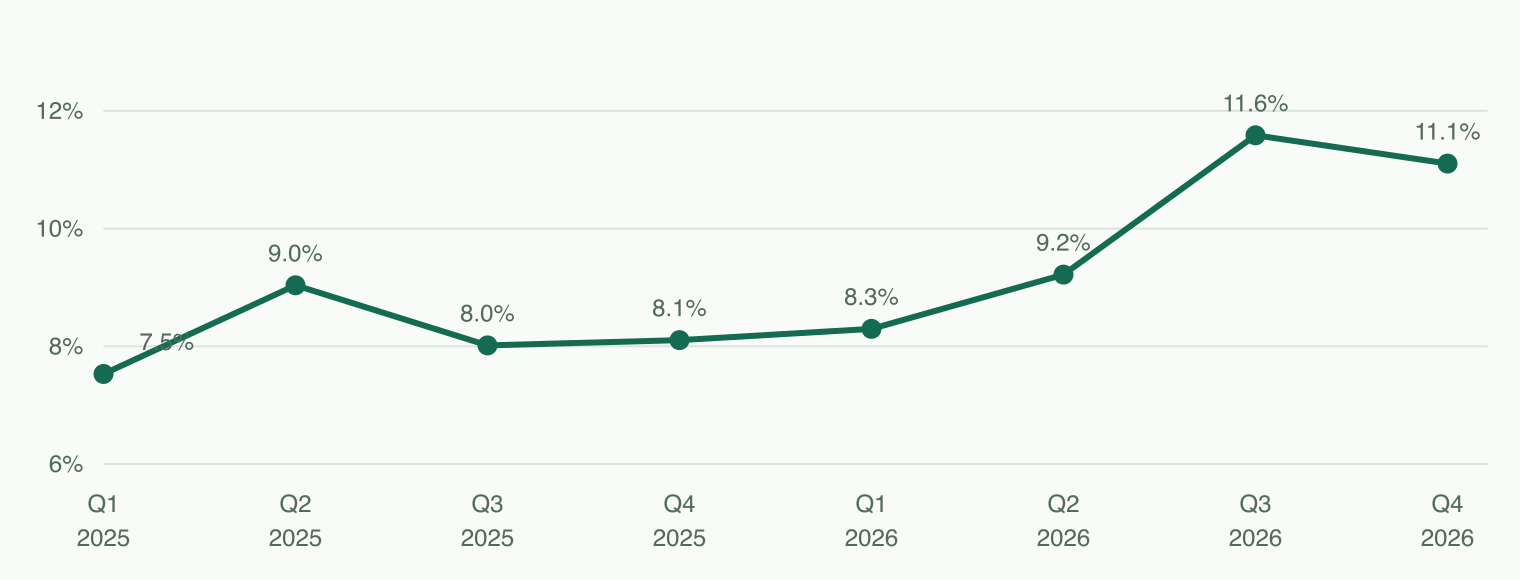
Revenue grew 11.1% against the matched quarter a year earlier. Operating margin increased from 3.88% to 3.97%, showing a modest improvement on a total-revenue basis rather than a dramatic change in the economics of the business.
Reported EPS increased 15.0%. However, a tariff-refund-related benefit contributed $0.15 per share. Removing that disclosed item gives $6.60 per share; the company’s supplement reports 12.4% EPS growth excluding it. This is a useful distinction between reported growth and growth without that particular one-off item, not a complete normalization of every earnings component. Official supplement, slide 5.
Margins also require context. Merchandise gross margin fell on the reported basis but improved after the company’s gasoline adjustment. The better operating margin therefore should not be presented as evidence that every margin improved.
Eight-quarter operating history
USD billions except EPS and percentages. Growth compares the same fiscal quarter a year earlier; operating margins use total revenue.
| Fiscal quarter | Weeks | Revenue | Revenue YoY | Operating margin | Diluted EPS | FCF |
|---|---|---|---|---|---|---|
| FY2025 Q1 | 12 | $62.15B | 7.5% | 3.53% | $4.04 | $2.00B |
| FY2025 Q2 | 12 | $63.72B | 9.0% | 3.63% | $4.02 | $1.61B |
| FY2025 Q3 | 12 | $63.21B | 8.0% | 4.00% | $4.28 | $2.33B |
| FY2025 Q4 | 16 | $86.16B | 8.1% | 3.88% | $5.87 | $1.90B |
| FY2026 Q1 | 12 | $67.31B | 8.3% | 3.66% | $4.50 | $3.16B |
| FY2026 Q2 | 12 | $69.60B | 9.2% | 3.74% | $4.58 | $1.71B |
| FY2026 Q3 | 12 | $70.53B | 11.6% | 3.99% | $4.93 | $2.04B |
| FY2026 Q4 | 16 | $95.72B | 11.1% | 3.97% | $6.75 | $2.49B |
Inputs: FY2026 Q1, Q2, Q3, Q4; FY2025 Q1, Q2, Q3, Q4. Standalone quarterly cash flow is derived from cumulative statements; Q4 equals the full year less the first 36 weeks.
The matched-year figures are more informative than a simple Q4-versus-Q3 revenue comparison. A longer quarter naturally produces more sales even without a change in the weekly pace of business.
Membership remains central to business quality
Adjusted comparable sales grew 6.7%, with traffic and adjusted ticket each increasing 3.3%. Paid memberships reached 84.1 million. Renewal rates were 92.3% in the U.S. and Canada and 89.8% worldwide. These measures support a positive assessment of member engagement, while not guaranteeing future retention. Official supplement, slides 2–4.
Membership-fee growth moderated from roughly 14.0% in Q1 to 7.3% in Q4. That deserves attention, but fee income is not a direct measure of loyalty: pricing, sign-ups, upgrades and recognition timing can affect it. Costco recognizes fees over the membership period. Q1 results; Q3 filing, Membership Fees.
2. Costco stock valuation: a dated trailing P/E snapshot
The September 28 closing price was $922.92. Dividing it by official FY2026 diluted EPS of $20.76 gives a trailing P/E of 44.46x. This uses annual earnings, not four times the latest quarter’s EPS. Dated price source; official annual EPS.
A trailing multiple tells us what investors paid for historical earnings; it does not establish fair value. Whether that price is justified depends on future growth, cash generation and risk. This review does not assign a fair-value target or claim that Costco is cheap relative to its history or peers.
3. Cash flow: stronger annual generation
FY2026 operating cash flow was $15.83B and property and equipment additions were $6.44B. Using the underlying unrounded figures gives FCF of $9.39B, versus $7.84B in FY2025. The standalone fourth-quarter figure was $2.49B, compared with $1.90B a year earlier.
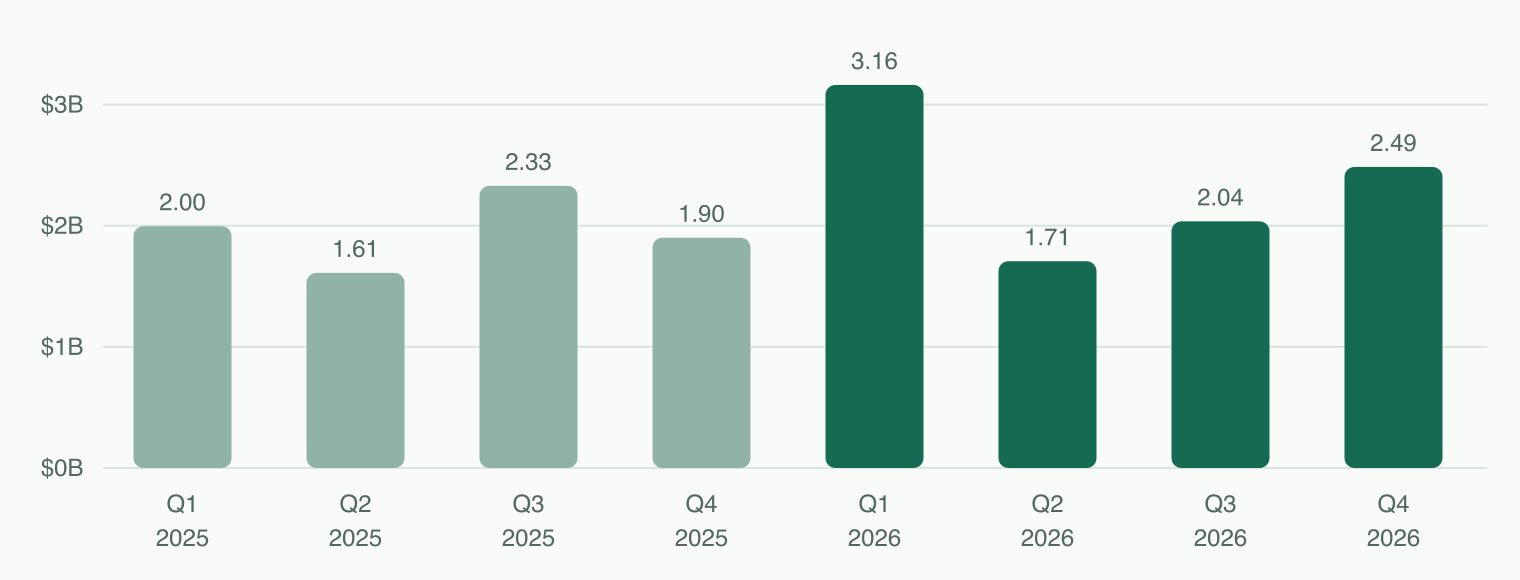
FCF is our calculation, not a company-defined adjusted measure. Quarterly figures account for cumulative reporting, and Q4 has 16 weeks rather than 12. Annual inputs; FY2026 Q3 inputs; FY2025 annual inputs; FY2025 Q3 inputs.
Stronger cash generation is encouraging, but it is not automatically permanent. Inventory, supplier payments and other working-capital movements can shift cash between periods. The next test is whether cash conversion remains supportive as expansion spending continues, rather than whether one quarter produces a high number.
4. Financial health: liquidity and returns on equity
The year-end balance sheet produces a current ratio of approximately 1.06 and a quick ratio of 0.57. The quick ratio includes cash, short-term investments and net receivables, but excludes inventory and other current assets. The gap makes inventory movement and supplier-payment terms relevant to a liquidity assessment.
The condensed release is not sufficient to assert a complete total-debt or net-cash figure. Costco’s earlier Q3 filing places some short-term borrowings inside other current liabilities. Large cash holdings therefore should not be translated into a blanket “debt-free” claim. Year-end balance sheet; Q3 filing, Bank Credit Facilities.
Annual ROE, calculated using average beginning and ending equity, declined from approximately 30.7% to 28.4% despite higher profit. This illustrates why ROE should be read alongside the size and financing of the asset base, not treated as a standalone score for operating improvement. It is a two-year comparison, not a five-year trend. FY2026 financial inputs; FY2025 inputs.
5. Forward signals: expansion and club-model context
Management’s supplemental schedule estimates 967 warehouses at FY2027 end, compared with 939 at FY2026 end. That is an expansion estimate, not a revenue or EPS forecast. Additional locations create an opportunity for growth, but their investment requirements and returns matter alongside the opening count. Official supplement, slide 7.
Costco versus Sam’s Club and BJ’s
Sam’s Club is the closer Walmart business-model comparison, rather than Walmart’s consolidated retail operations.
| Business | Reported period | Comparable-sales measure | Membership-fee growth, YoY |
|---|---|---|---|
| Costco worldwide | Q4 FY2026; 16 weeks ended Aug. 30 | 6.7%; adjusted for gasoline-price changes and FX | 7.3% |
| Sam’s Club U.S. (Walmart) | Q2 FY2027; 13-week comp period ended July 31 | 4.4%; excluding fuel | 6% |
| BJ’s U.S. clubs | Q2 FY2026; 13 weeks ended Aug. 1 | 3.1%; excluding gasoline sales | 9.9% |
Sources: Costco supplement; Walmart, Sam’s Club segment and comp footnote; BJ’s Q2 results.
This is operating context, not a like-for-like ranking. The periods, geography and fuel adjustments differ. All three reported membership-fee growth, but the growth rates do not establish relative retention or market-share gains. No sector median or peer valuation ranking is inferred from this small sample.
Bottom line
Costco delivered meaningful operating progress: matched-year revenue growth, high renewal rates and stronger annual cash flow. The qualifications are equally important: a one-off EPS benefit, moderating fee growth and the capital required to expand.
The dated 44.46x trailing multiple keeps future execution central to the investment debate. The next quarterly review should focus on traffic and renewals, recurring earnings, cash conversion and the returns from expansion. A strong business result is not, by itself, a buy signal.
Costco Q4 FY2026 earnings FAQ
What were Costco’s Q4 FY2026 revenue and EPS?
Total revenue, including membership fees, was $95.72 billion, up 11.1% year over year. Reported diluted EPS was $6.75, including a disclosed $0.15 one-off benefit. See the results table and EPS discussion for the reporting basis.
Why compare Costco’s fourth quarter with the prior-year fourth quarter?
Q4 covers 16 weeks, while each of the first three quarters covers 12. A matched-year comparison avoids confusing a longer reporting period with faster growth. The eight-quarter history identifies the length of each period.
Is Costco’s Q4 free cash flow reported or calculated?
The $2.49 billion figure is calculated as operating cash flow minus property and equipment additions. Because Costco reports cumulative cash flow, standalone Q4 is the full year less the first 36 weeks. See the cash-flow analysis and source inputs.
Does a strong earnings report make Costco stock a buy?
Not by itself. Business performance and the price paid for it are separate questions. This review uses a dated trailing P/E snapshot, does not estimate fair value and is not a buy or sell recommendation. See the valuation discussion.
Continue your research
Explore our quarterly earnings analysis archive for the five-layer research framework. For the charting side of company research, see our TradingView review; chart analysis complements, rather than replaces, a review of financial results.
Methodology and disclosure
This analysis follows five fundamental layers and covers the latest reported quarter, eight-quarter operating history and selected annual measures. It is not an exhaustive assessment of all 26 research checks. Figures are in USD; calculated ratios, FCF and valuation are distinguished from company disclosures.
Sources include official earnings releases, the SEC-filed supplement and earlier filings. The FY2026 full 10-K was not identified in the September 29 check; the latest annual figures therefore come from the unaudited earnings release. SEC earnings filing.
Prices are a dated snapshot, not live quotes. No unverified analyst target, forward EPS revision, insider sentiment or complete net-debt estimate is used to support the conclusion. AI-assisted research and drafting were used alongside source-linked calculations. This article is educational, not personalized investment advice or a recommendation to buy or sell a security.