
Last verified: August 3, 2026
TradingView is a charting and market-research platform with web, desktop, and mobile access. Its main strengths are a flexible chart workspace, broad market coverage, screeners, alerts, Paper Trading, Pine Script, and a large library of community-published ideas and indicators. Its weaknesses include plan limits, advertisements on Basic, separately priced exchange data in some markets, and the risk that beginners add complexity without improving their process.
Our view: TradingView is a strong starting platform for visual market research and simulated practice. The free Basic plan should be the default first choice. A paid plan is easier to justify after a specific chart, indicator, alert, history, or workflow limit becomes measurable.
Important: TradingView is not a guarantee of trading performance. Broker availability, market data, pricing, and features vary by jurisdiction, device, exchange, and subscription.
TradingView Review at a Glance
Our verdict: TradingView is a useful charting and research workspace, but a paid subscription is not a shortcut to better trading results. Start with Basic to learn the interface and practise with simulated funds. Consider paying when a specific chart, indicator or alert limit gets in the way of your workflow.
- Best fit: people who want browser-based chart research and simulated practice.
- Main trade-offs: free-plan limits, advertisements on Basic and possible extra exchange-data costs.
- Not a replacement for: checking your broker, your market-data feed or the risks of a trade.
Who TradingView Is Best For
- Beginners who want to learn chart navigation and simulated order placement.
- Investors and traders who monitor several asset classes in one interface.
- Users who prefer browser-based charts and synchronized layouts.
- Researchers who use alerts and screeners to reduce constant chart watching.
- Pine Script users who want to create, test, or publish chart tools.
TradingView may be a weaker fit for someone who needs broker-specific execution features above charting, guaranteed direct exchange data in the base subscription, or an entirely offline platform.
If the use cases above match your workflow, open TradingView Basic and test the free plan before comparing upgrades.
TradingView Core Features
| Supercharts | Multi-market charts with timeframes, chart types, indicators, drawings, layouts, and research panels. |
| Screeners | Filter and sort supported stocks, ETFs, forex, crypto, and other market groups using available datasets. |
| Alerts | Monitor price, technical, drawing, strategy, and supported watchlist conditions. |
| Paper Trading | Use simulated funds to practise order placement without a deposit. |
| Pine Script | TradingView’s programming language for custom indicators, strategies, and libraries. |
| Community | Published ideas, educational content, and public or protected scripts. |
| Broker connections | Trade through supported brokers where the integration and jurisdiction allow it. |
Supercharts, Indicators, and Drawing Tools
Supercharts is TradingView’s central workspace. The top toolbar handles symbols, timeframes, chart types, indicators, alerts, and layouts. Drawing tools appear on the left, while watchlists and research panels commonly open on the right.
The charting experience is flexible, but flexibility can become clutter. A useful beginner layout needs one verified symbol, one timeframe, a readable chart type, and only the indicators that answer a defined question. See our TradingView beginner’s guide for a step-by-step setup.
TradingView includes built-in indicators and community scripts. Community publication is not independent validation. Review the calculation, source access, repainting behavior, assumptions, and testing method before using a script.
Alerts and Screeners
Alerts are one of TradingView’s most useful workflow features. They can monitor a price level or a supported technical condition and send notifications through available channels. Technical-alert availability and active limits depend on the plan.
Screeners make it possible to narrow a market using selected filters and sortable fields. A screener result is a research shortlist, not a recommendation. Filters can exclude relevant securities or highlight results that merely fit historical data.
Build alerts carefully with our TradingView alerts guide.
Pine Script and Community Tools
Pine Script allows users to create custom chart indicators, strategies, and libraries. It is useful for expressing a rule consistently and evaluating historical behavior. A backtest still depends on data quality, assumptions, order modeling, costs, parameter selection, and the risk of overfitting.
The community provides a large library of ideas and scripts. Treat public content as a starting point for research. Do not assume that a highly liked script is suitable for your market, timeframe, or risk tolerance.
Paper Trading and Broker Connections
TradingView Paper Trading is a built-in simulator with virtual funds. It is helpful for learning the order ticket and testing a recorded process without depositing money. Simulated execution does not fully reproduce slippage, liquidity, live broker charges, taxes, or the psychology of risking capital.
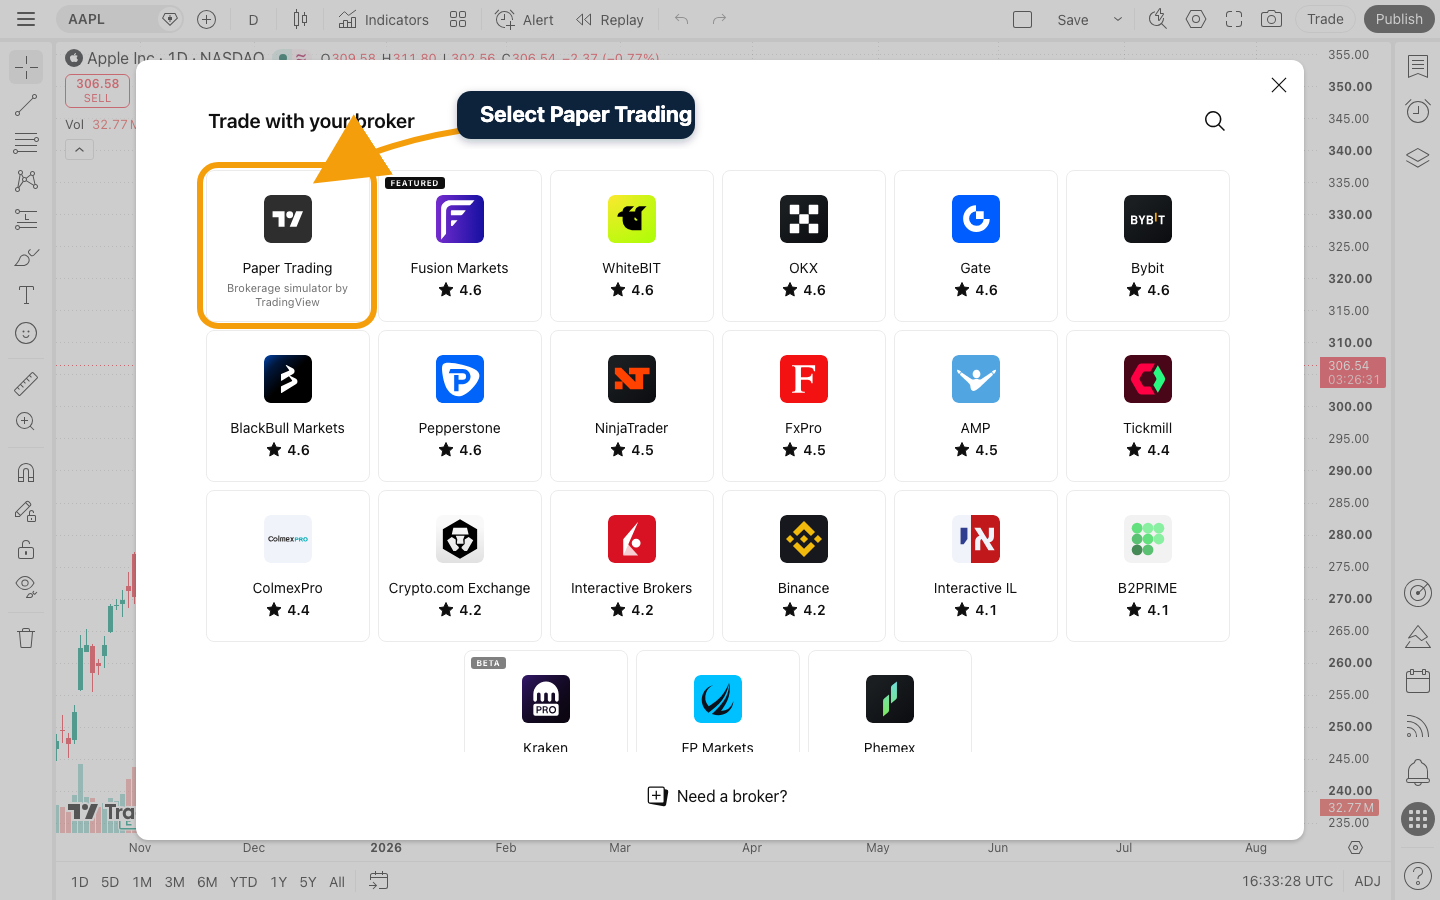
TradingView also connects to supported brokers. The available list and tradable markets can differ by country and account. Verify the broker’s legal entity, regulation, fees, product offering, and execution terms independently before connecting a real account. Read our Paper Trading guide first.
TradingView Basic and Paid Plans
TradingView currently offers Basic, Essential, Plus, Premium, and Ultimate. On the verification date, Basic included one chart per tab, two indicators per chart, one saved layout, 5,000 historical bars, and three price alerts. Paid tiers progressively increased chart, indicator, history, alert, connection, and workflow limits.
Pricing is localized and can change with currency, tax, billing period, and promotion. Some real-time exchange feeds cost extra, and professional market-data status can change exchange fees. Review our current TradingView pricing comparison rather than relying on an old promotional price.
TradingView Data: Real Time or Delayed?
Data status depends on the symbol and exchange. Some feeds are real time, while others can be delayed or require a separate exchange subscription. Selecting a paid charting plan does not automatically unlock every official real-time feed.
Confirm the exchange, provider, instrument type, and data status on every chart used for time-sensitive analysis. Similar tickers can represent different listings or broker-derived products.
TradingView Pros and Cons
| Advantages | Limitations |
|---|---|
| Accessible web, desktop, and mobile charting. | Basic includes ads and low chart, indicator, and alert limits. |
| Broad set of chart, drawing, screening, alert, and research tools. | Some official real-time exchange data is sold separately. |
| Built-in Paper Trading for practice. | Simulation cannot reproduce every live execution condition. |
| Pine Script and a large script ecosystem. | Community popularity does not validate a script or idea. |
| Supported broker integrations. | Broker and market availability varies by jurisdiction. |
| Free plan suitable for learning. | Complex layouts can encourage indicator and alert clutter. |
TradingView Safety and Trust
Use a unique password, enable available account security controls, and never share authentication or broker credentials through community messages. Treat invitations to private scripts, guaranteed-return claims, and urgent payment requests with caution.
Connecting a broker does not remove the need to verify the broker itself. TradingView supplies the interface integration, while the broker’s entity and terms govern the trading account.
TradingView Review Verdict
TradingView is a capable charting and research platform for users who value accessible charts, alerts, screeners, custom scripts, and simulated practice. The free plan is the correct first step for most beginners. Paid tiers are easier to justify for experienced users who can name the exact chart, indicator, alert, history, or connection limit that blocks an established workflow.
Try TradingView Basic Decide if Paid Is Worth It
Affiliate note: We may earn a commission from qualifying TradingView purchases made through our links, at no extra cost to you.
TradingView Review: Common Questions
Can I use TradingView without paying?
Yes. TradingView offers a free Basic plan. Its limits and advertisements are the main trade-offs. Start with the free workspace and compare the free and paid options only if a limit affects what you need to do.
Does TradingView Paper Trading use real money?
No. The built-in Paper Trading account uses simulated funds and does not require a deposit. Connecting a separate supported live broker account is different: orders in that account can risk real money. Check which account is connected before placing an order. See our Paper Trading guide.
Is TradingView itself a broker?
No. TradingView is a charting and research platform that can connect to supported brokers. A broker connection does not make TradingView the broker or replace checking the broker’s legal entity, regulation, fees and available markets.
Does a paid plan include every real-time data feed?
No. Some exchange data requires a separate subscription. Check the symbol’s exchange, provider and data status rather than assuming that upgrading the charting plan removes every delay.