
Netflix’s Q3 2026 earnings show a profitable, cash-generating business, but a more mixed outlook than the headline profit increase suggests. Revenue reached $12.87 billion and diluted EPS was $0.87. Our assessment: the quarter was solid operationally, while the lower advertising and free-cash-flow forecasts deserve attention before extrapolating the improvement.
Netflix Q3 2026 earnings at a glance
| Metric | July company forecast for Q3 | Reported Q3 result |
|---|---|---|
| Revenue | 12,860 | 12,874 |
| Operating income | 4,268 | 4,459 |
| Operating margin | 33.2% | 34.6% |
| Net income | 3,452 | 3,664 |
| Diluted EPS (USD/share) | 0.82 | 0.87 |
| Operating cash flow | Not recorded | 3,162 |
| Free cash flow (non-GAAP) | Not recorded | 2,884 |
Revenue was essentially on the company’s July forecast, while operating income and EPS exceeded that forecast. The comparison is with management’s own guidance, not analyst consensus. Netflix attributes the operating-profit upside primarily to expense timing. Q3 shareholder letter, pages 1-2; July forecast, page 1.
The distinction matters: a quarterly result can exceed an internal forecast without demonstrating a permanent improvement in the business. Our reading puts more weight on the full-year margin commitment and the revised growth outlook than on a single quarterly surprise.
Eight reported quarters: Q4 2024 through Q3 2026
| Quarter / period end | Revenue | Operating profit | Operating margin | Net income | Diluted EPS |
|---|---|---|---|---|---|
| Q4 2024 / 2024-12-31 | 10,247 | 2,273 | 22.2% | 1,869 | 0.43 |
| Q1 2025 / 2025-03-31 | 10,543 | 3,347 | 31.7% | 2,890 | 0.66 |
| Q2 2025 / 2025-06-30 | 11,079 | 3,775 | 34.1% | 3,125 | 0.72 |
| Q3 2025 / 2025-09-30 | 11,510 | 3,248 | 28.2% | 2,547 | 0.59 |
| Q4 2025 / 2025-12-31 | 12,051 | 2,957 | 24.5% | 2,419 | 0.56 |
| Q1 2026 / 2026-03-31 | 12,250 | 3,957 | 32.3% | 5,283 | 1.23 |
| Q2 2026 / 2026-06-30 | 12,560 | 4,193 | 33.4% | 3,401 | 0.80 |
| Q3 2026 / 2026-09-30 | 12,874 | 4,459 | 34.6% | 3,664 | 0.87 |
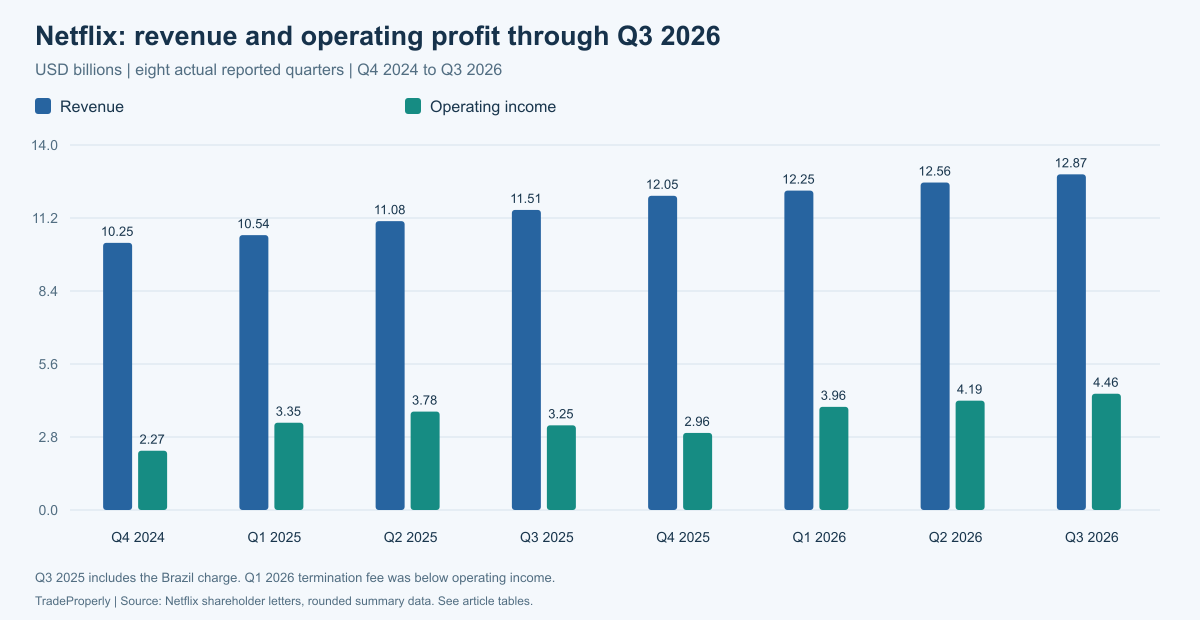
These are rounded issuer summary figures, not estimates. EPS uses the company’s restated basis for its November 2025 ten-for-one split. Q4 2026 forecasts are excluded from the historical charts. Q4 2025 summary; Q2 2026 summary; Q3 2026 statements, page 8.
The history is useful precisely because the revenue, operating-profit and net-income series do not tell identical stories. Reading them together helps avoid mistaking a below-operating-line gain or an unusually weak comparison period for a new recurring earnings run rate.
1. Profitability: the prior-year comparison needs context
Using the unrounded statements, revenue increased 11.8% year over year, operating income 37.3% and net income 43.9%. The reported operating margin rose to 34.6% from 28.2%.
However, Q3 2025 included approximately $619 million of Brazilian non-income-tax expense in cost of revenue, covering periods from 2022 through Q3 2025. It was not simply an income-tax-line item. Q3 2025 shareholder letter, page 2.
Our illustrative sensitivity: adding that charge back to the prior-year operating result produces about $3.87 billion of comparison-period operating income and a 33.6% margin. Against that limited adjustment, Q3 2026 operating-profit growth is about 15.3%, rather than the reported 37.3%. This is not a fully normalized result or a company-issued comparable-growth measure: it removes one identified prior-year expense, without adjusting either period for every unusual item.
The sensitivity changes the interpretation, not the reported numbers. Profitability still improved, but the headline growth rate overstates the improvement relative to a comparison period without that charge. Expense timing adds another reason not to annualize this quarter’s margin.
The reviewed disclosures do not quantify the expense categories behind the timing benefit or how much will reverse in Q4. We therefore do not convert the quarterly upside into a permanent cost saving. The Q3 Form 10-Q separately confirms the prior-year Brazil charge in its cost-of-revenues discussion. Q3 Form 10-Q, MD&A: Cost of Revenues.
Q1 2026 also needs separate treatment: the $2.8 billion WBD transaction termination fee was recognized below operating income. It elevated reported net income and EPS, not the operating-profit series. We do not subtract a pretax fee directly from after-tax earnings to invent normalized EPS. Q2 Form 10-Q, WBD transaction note.
2. Cash flow: positive conversion, with content spending already included
| Quarter | Operating cash flow | Free cash flow |
|---|---|---|
| Q4 2024 | 1,537 | 1,378 |
| Q1 2025 | 2,789 | 2,661 |
| Q2 2025 | 2,423 | 2,267 |
| Q3 2025 | 2,825 | 2,660 |
| Q4 2025 | 2,112 | 1,872 |
| Q1 2026 | 5,290 | 5,094 |
| Q2 2026 | 1,744 | 1,525 |
| Q3 2026 | 3,162 | 2,884 |
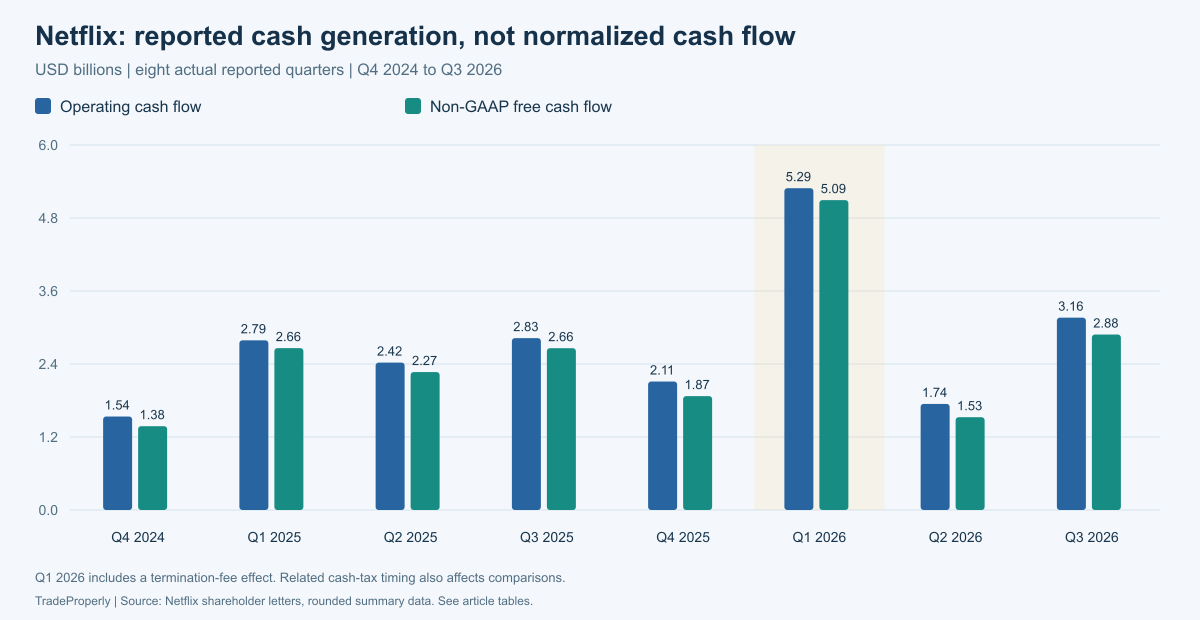
The exact Q3 reconciliation, in USD millions, is 3,162.279 operating cash flow minus 278.766 property-and-equipment purchases = 2,883.513 free cash flow. FCF is the company’s non-GAAP liquidity measure. It increased 8.4% year over year and equaled approximately 78.7% of net income, or 22.4% of revenue. These percentages are our calculations, not management targets. Cash-flow statement and FCF reconciliation, pages 10-11.
Content payments already affect operating cash flow. The Q3 statement records $5.160 billion of content additions, a $0.094 billion positive change in content liabilities and $4.235 billion of amortization. Additions less that liability change imply approximately $5.066 billion of content cash spending in this reconciliation. Deducting it again from FCF would double-count the outflow.
Our reading: cash generation supports the operating result, but reported FCF is not synonymous with cash available for unlimited distributions. Acquisitions and financing uses sit elsewhere in the cash-flow statement. Historical comparisons also retain the Q1 termination-fee effect and related cash-tax timing; the chart is not normalized cash flow.
The annual FCF outlook is now approximately $12.0 billion, down from $12.5 billion, primarily because of an expected Q4 real-estate transaction. That explanation differs from a claim that subscription cash generation deteriorated by the same amount. It is nevertheless a reduction in the cash-flow forecast investors should track. Capital-allocation discussion, page 5.
The materials reviewed do not identify that transaction’s type or future cash-flow classification. We do not assume it is a property purchase, lease payment or sale. Management retained an approximately 1.1x annual cash-content-spend-to-amortization expectation; that annual ratio does not supply a disclosed Q4 spending figure.
3. Financial strength: buybacks exceeded this quarter’s FCF
| Measure | Amount |
|---|---|
| Cash and cash equivalents | 8.19 |
| Short-term investments | 0.03 |
| Current assets | 13.22 |
| Current liabilities | 12.30 |
| Current plus long-term debt: carrying amount | 15.13 |
| Total streaming content obligations | 25.22 |
The table uses balance-sheet carrying amounts for debt. Separately, management describes approximately $15.3 billion of gross debt and $8.2 billion of cash, following a $1 billion bond issuance ahead of a $1 billion Q4 maturity. We keep these definitions separate instead of mixing a narrative gross-debt amount with a carrying-value calculation. Content obligations include both recognized liabilities and commitments not yet recognized; they should not all be relabeled financial borrowings. Pages 5 and 9.
Q3 cash repurchases were $4.797 billion, approximately $1.913 billion more than the quarter’s FCF. This does not by itself establish financial stress, but it means repurchases were not covered solely by that quarter’s free cash generation. Balance-sheet cash, borrowing, other cash flows and the maturity schedule also matter. An authorization is capacity, not a commitment to spend it immediately.
4. Valuation: a better quarter is not automatically a cheap stock
This review does not assign a current P/E, price target or buy/sell recommendation. A usable valuation requires a dated share price and a clearly defined earnings basis. In particular, trailing reported EPS includes the Q1 termination-fee effect, while the Q4 EPS figure below remains a forecast.
For investors building their own valuation, the practical questions are whether the advertising rollout catches up, how much expense timing reverses, and whether recurring cash generation can support content investment and capital returns. Paying a higher multiple for growth requires evidence that the growth is durable; a strong reported EPS comparison alone does not answer that question.
5. Outlook: annual margin holds, but advertising and FCF forecasts fall
| Measure | July outlook | October update |
|---|---|---|
| Revenue (USD billions) | 51.0-51.4 | 51.1 |
| Operating margin | 31.5% | 31.5% |
| FCF (USD billions) | Approximately 12.5 | Approximately 12.0 |
| Advertising revenue (USD billions) | Approximately 3.0 | Approximately 2.7 |
The revised ad-revenue expectation is approximately 10% below the prior $3.0 billion figure, using the rounded forecasts. Netflix links the reduction to slower deployment of some ad-product capabilities. We treat this as an execution issue to monitor, not evidence that the entire advertising opportunity has disappeared. Conversely, future product launches should not be counted as revenue already earned. Updated guidance, page 2.
What the earnings interview adds
In the published interview transcript, Greg Peters attributes delays to product rollouts and partner integrations. He describes advertising growth of over 80% for 2026 and says advertiser demand remains strong. This is management’s full-year characterization, not a Q3 growth rate or completed full-year result. The cited answers do not identify the delayed products or give a recovery date. October 20 interview transcript: Baird advertising question.
Our interpretation: execution is the explanation management supplies, but it does not independently rule out pricing or inventory constraints. We do not turn qualitative demand commentary into an undisclosed numerical KPI.
The shareholder letter reports improved churn globally and in the US, without an exact rate. Its India example shows 24% growth in viewing hours and approximately 18% revenue growth at constant currency. A country example is useful evidence of the model, but it is not a global viewing-growth rate. Shareholder letter, pages 2-5.
| Metric | Q4 outlook |
|---|---|
| Revenue (USD millions) | 13,442 |
| Revenue growth year over year | 11.5% |
| Operating income (USD millions) | 3,500 |
| Operating margin | 26.0% |
| Net income (USD millions) | 2,787 |
| Diluted EPS (USD/share) | 0.67 |
The 26.0% Q4 margin forecast includes approximately 120 basis points of pressure from announced headcount reductions. The 31.5% full-year margin forecast includes about 30 basis points from those reductions. Both remain forward-looking, not achieved results. Comparing Q3’s 34.6% margin directly with the Q4 forecast without expense timing and seasonality would be misleading.
In the transcript’s Guggenheim response, CFO Spence Neumann declines to quantify the 2027 expense impact. He says 2027 guidance, including margins, will come in January. His separate JPMorgan response describes growth objectives, not a numerical 2027 forecast. October 20 interview transcript: 2027 outlook and expense-impact questions.
We therefore do not book a hypothetical 2027 savings figure or treat restructuring charges as a disclosed cash-payment schedule. A forecast margin impact alone is insufficient to establish either.
What we will watch next: delivery against the $13.442 billion Q4 revenue forecast, progress on advertising capabilities, content cash spending relative to amortization, and the cash cost of capital returns. These are testable follow-up points, not predictions of the share-price direction.
Explore Netflix earnings and financial statements on TradingView
Netflix’s official disclosures control the accounting figures in this article. TradingView provides a convenient next step for exploring earnings history, estimates and financial statements. Check the period and units before making comparisons.
Read our TradingView review for a platform introduction, or the TSMC earnings analysis for another source-led report. These are different business models, not a direct peer-valuation comparison.
Netflix Q3 2026 earnings FAQ
Was Netflix’s Q3 2026 report good overall?
Our assessment is positive on current profitability and cash generation, but mixed on the outlook. The lower advertising and FCF expectations, prior-year Brazil charge and expense timing prevent a simple conclusion that the headline profit growth is entirely recurring improvement.
What were Netflix’s actual Q3 revenue and EPS?
Revenue was $12.874 billion and diluted EPS was $0.87. The earlier $0.82 EPS figure was July company guidance, not the reported result or independently verified analyst consensus.
What does Netflix expect for Q4 2026?
The company’s October 20 forecast is $13.442 billion of revenue, a 26.0% operating margin and $0.67 diluted EPS. These are forecasts for the quarter ending December 31, 2026, not historical results.
Is Netflix’s free cash flow a GAAP profit measure?
No. It is a non-GAAP liquidity measure defined here as operating cash flow less property-and-equipment purchases. Content cash flows already affect operating cash flow. Neither the chart nor this definition removes every exceptional item.
Methodology: source-led fundamental analysis
Our five layers are profitability, cash flow, financial strength, valuation and forward signals. Reported figures, forecasts, calculations and editorial interpretation are distinguished. Accounting figures come from Netflix’s disclosures. Selected interview statements were checked against a third-party published transcript, not independently against the original recording; speaker and question references are supplied rather than invented timestamps. No unverified market-price conclusions are included. AI assisted research and drafting. This is educational analysis, not personalized investment advice.
Sources
- Netflix Q3 2026 Form 10-Q: Note 7 debt; MD&A cost of revenues and liquidity; statements through September 30, 2026
- October 20 earnings interview: transcript published by The Motley Fool: Executive Q&A: Baird advertising; JPMorgan 2027 outlook; Guggenheim expense impact. Third-party transcription, not issuer-hosted or original-audio verification
- Netflix Q3 2026 shareholder letter and financial statements: October 20, 2026; p1 summary; p2 outlook and expense timing; p5 cash and capital; p8-11 statements and FCF reconciliation
- Netflix Q3 2026 shareholder letter: SEC exhibit 99.1: Same company letter, not an independent second data provider
- Netflix Q3 2025 shareholder letter: p2: approximately $619M Brazilian non-income tax expense booked in cost of revenue
- Netflix Q2 2026 shareholder letter filed with SEC: p1 summary and Q3 forecast; p2 outlook; p5 cash and capital; p10-13 statements and FCF reconciliation
- Netflix Q4 2025 shareholder letter: p1 reported quarterly summary, with split-adjusted EPS
- Netflix Q2 2026 Form 10-Q on issuer filing CDN: WBD transaction note: $2.8B fee received in Q1, recorded in interest and other income; segment note repeats classification