
TSMC Q3 2026 earnings show strong growth, but the next test is whether the 2nm ramp can sustain profitability and cash generation. Our reading: a stronger business quarter does not, by itself, establish that TSM shares are attractively priced.
Earnings at a glance
| Metric | Q3 2026 | Comparison / definition |
|---|---|---|
| Revenue (US$ billions) | 46.72 | +41.2% YoY; +16.2% QoQ (issuer-reported) |
| Revenue (NT$ billions) | 1,494.24 | +50.9% YoY; +17.6% QoQ |
| Parent-attributable net income (NT$ billions) | 763.06 | +68.7% YoY |
| Diluted EPS: ordinary share (NT$) | 29.43 | +68.7% YoY (issuer-reported) |
| Diluted EPS: ADR (US$) | 4.60 | One ADR represents five ordinary shares |
| Gross margin | 66.4% | +6.9 percentage points YoY; -1.3 points QoQ |
| Operating margin | 58.7% | +8.1 percentage points YoY; -1.6 points QoQ |
Source: earnings release, page 1. The revenue comparison uses each period’s reported currency basis, rather than converting every period at today’s exchange rate.
A period and currency guide
Q3 2026 means the three months ended September 30, 2026, not a forecast. NT$ means New Taiwan dollars; US$ means U.S. dollars. One TSM ADR represents five ordinary shares. The ordinary-share EPS and ADR EPS are not interchangeable. Historical tables below retain NT$ figures to avoid mixing share classes or retranslating old periods. Financial statements, page 2 and notes.
1. Profitability: strong growth, with a sequential margin trade-off
| Reported quarter / period end | Revenue | Parent net income | Diluted EPS | Gross margin |
|---|---|---|---|---|
| Q4 2024 / 2024-12-31 | 868.46 | 374.68 | 14.45 | 59.0% |
| Q1 2025 / 2025-03-31 | 839.25 | 361.56 | 13.94 | 58.8% |
| Q2 2025 / 2025-06-30 | 933.79 | 398.27 | 15.36 | 58.6% |
| Q3 2025 / 2025-09-30 | 989.92 | 452.30 | 17.44 | 59.5% |
| Q4 2025 / 2025-12-31 | 1,046.09 | 505.74 | 19.50 | 62.3% |
| Q1 2026 / 2026-03-31 | 1,134.10 | 572.48 | 22.08 | 66.2% |
| Q2 2026 / 2026-06-30 | 1,270.38 | 706.56 | 27.25 | 67.7% |
| Q3 2026 / 2026-09-30 | 1,494.24 | 763.06 | 29.43 | 66.4% |
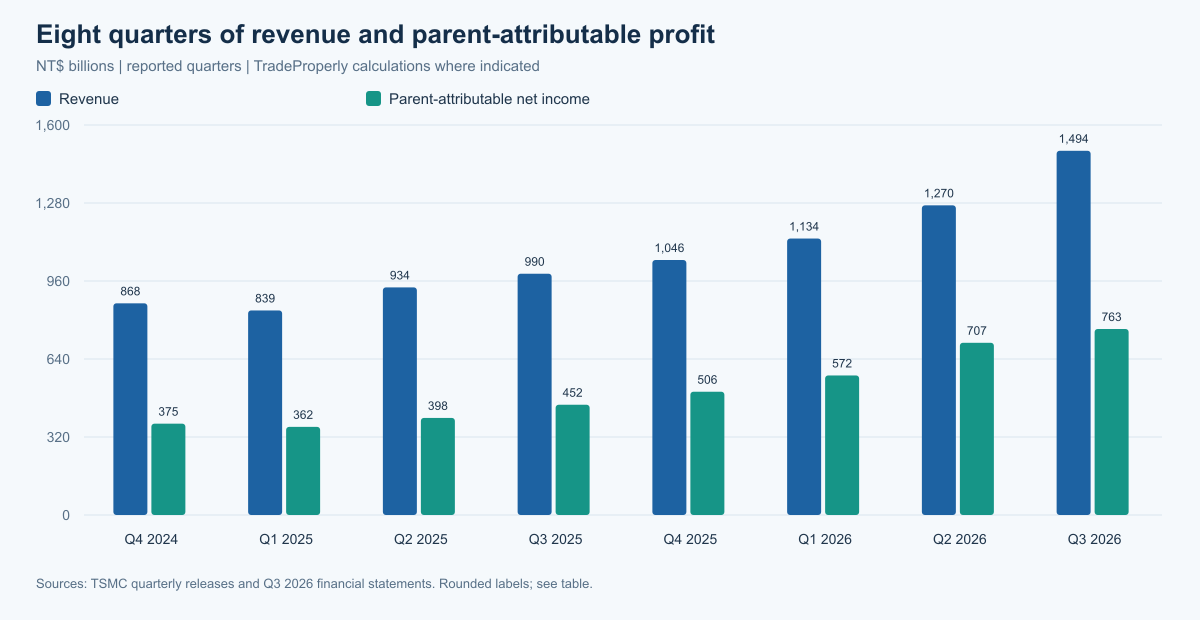
The history shows why the comparison period matters. Recent revenue expansion is visible across several quarters; the margin reading is more nuanced. Gross margin improved against Q3 2025 but eased from Q2 2026. A lower sequential margin can coexist with higher gross profit when sales expand enough.
Management attributes the sequential gross-margin dilution primarily to the initial N2 ramp. HPC represented 68% of net revenue, while 2nm accounted for 8% of wafer revenue. These use different denominators. HPC is not a separately reported measure of AI revenue, so we do not relabel its entire share as AI sales. Management report, page 2.
Q2 also benefited from non-operating gains involving VIS shares that were not repeated in Q3. That limits the usefulness of extrapolating Q2’s net margin. Our emphasis is on operating performance alongside bottom-line profit, not EPS alone. Management report, page 3.
2. Cash flow: profit is only part of the story
| Quarter | Operating cash flow | Cash PP&E acquisitions | Calculated FCF |
|---|---|---|---|
| Q3 2025 | 426.83 | 287.45 | 139.38 |
| Q2 2026 | 783.37 | 496.00 | 287.36 |
| Q3 2026 | 919.78 | 443.21 | 476.57 |
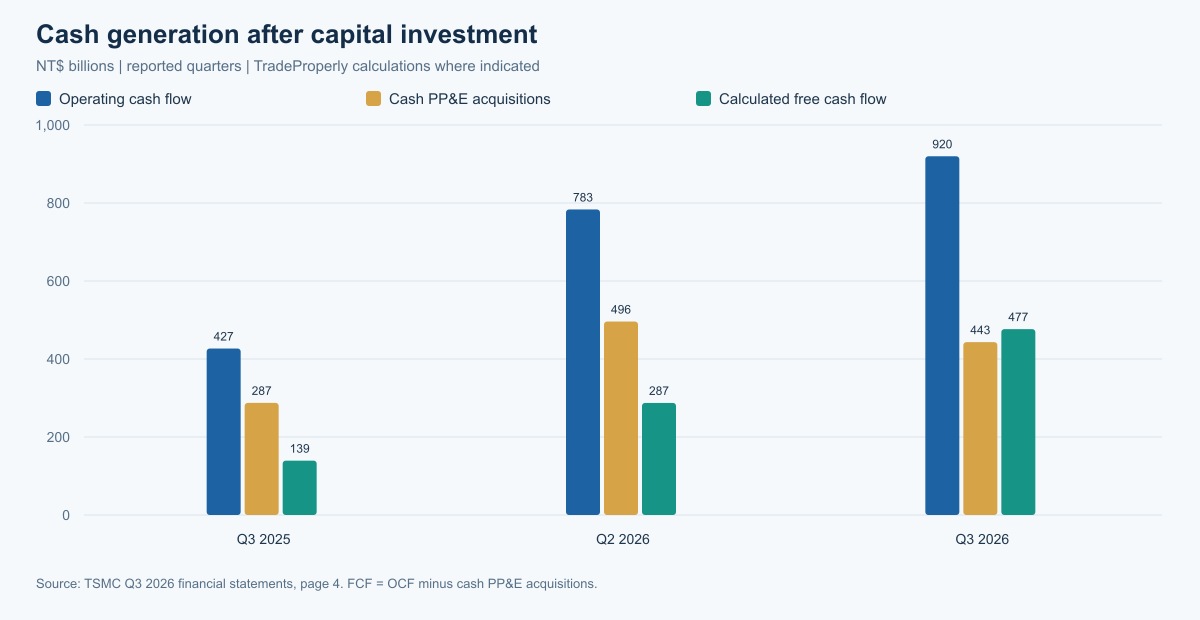
We calculate free cash flow as operating cash flow minus cash acquisitions of property, plant and equipment, using TSMC’s quarterly NT$ financial statements. On this basis, calculated FCF was NT$476.57 billion, or 31.9% of revenue. Operating cash flow covered parent-attributable net income by approximately 1.21 times. Financial statements, page 4; calculations by TradeProperly.
This is substantial internal funding after investment, but not cash that can automatically be distributed: cash tax timing, reinvestment and financing needs still matter. The company also identifies U.S. investment tax credits within investing inflows. Those receipts are not operating cash flow and are not added to our FCF definition. Management report, page 5.
On the earnings call, CFO Wendell Huang reiterated a US$60–64 billion full-year 2026 capital budget. This is an annual plan, not quarterly spending. He did not provide specific 2027–2028 budgets. Call transcript, 00:07:45 and 00:48:27.
3. Financial strength: funding capacity, not immunity to risk
| Measure | Value | Definition / basis |
|---|---|---|
| Cash plus current marketable instruments | 4,016.98 | Cash plus current marketable financial instruments |
| Company interest-bearing debt | 1,031.58 | Company definition, not just bonds |
| Company net cash reserves | 2,985.40 | Company liquidity less defined interest-bearing debt |
| Current ratio | 2.6x | Current assets / current liabilities |
| Cash balance | 3,621.89 | Ending cash, balance-sheet basis |
The company’s net-cash-reserves measure includes marketable securities and uses its own interest-bearing debt definition; it is not cash minus only the visible bonds line. Likewise, the reported ROE of 45.5% is annualized, not a return earned in one quarter. Presentation, slides 3 and 6.
Liquidity provides room to fund investment through uneven demand. It does not remove construction, utilization, customer-concentration or geopolitical risk. A larger inventory balance alone is also insufficient to diagnose weak demand: the company’s inventory-days measure fell from 87 to 82 days sequentially. Management report, page 4.
4. Valuation: good results are not a buy signal
This analysis does not assign a price target, a cheap/expensive label or a forward P/E. We have not locked a dated market-price snapshot and a comparable earnings basis for that purpose.
A defensible TSM valuation must pair an ADR price in U.S. dollars with compatible ADR earnings. It must distinguish trailing reported earnings from forward estimates, and avoid treating four times this quarter’s EPS as a trailing-year result. The eight-quarter history supplies context, not a claim about fair value. Q4 2025 and Q1 2026, for example, are separately reported periods, not estimates reconstructed from today’s data. Q4 2025 release, Q1 2026 release.
5. Q4 outlook: a higher revenue target, with margin discipline still central
| Measure | Management range | Basis |
|---|---|---|
| Revenue | US$52.3B-54.3B | Quarter ending December 31, 2026 |
| Gross margin | 65%-67% | FX assumption NT$31.8 per US$1 |
| Operating margin | 56.5%-58.5% | FX assumption NT$31.8 per US$1 |
Q3 revenue was 2.0% above the upper end of the company’s prior revenue guidance. That is a comparison with management’s range, not an analyst-consensus beat. Q4’s revenue midpoint implies approximately 14.1% sequential growth; it is a calculation from guidance, not reported Q4 revenue. Presentation, slides 3 and 8.
Huang attributed Q4 margin pressure to the steep 2nm ramp and overseas fabs, partly offset by productivity and cross-node capacity optimization. These are management’s expectations, not realized cost savings. Call transcript, 00:06:39.
Management Q&A: demand conviction versus execution risk
Citi analyst Laura Chen asked whether power, financing and component bottlenecks could create a mismatch between chip capacity and AI deployment. CEO C.C. Wei said capacity planning considers those constraints and management still sees demand exceeding supply. This is management’s assessment, not independent proof that overbuilding risk is absent. Call transcript, 00:20:55–00:23:51.
Our takeaway: monitor whether capacity becomes profitable customer shipments, rather than treating AI demand commentary as guaranteed revenue.
For the next report, our checklist is straightforward: whether growth reaches the range, whether gross margin holds within guidance, and whether cash generation keeps pace with investment. We would also watch the economics of the 2nm ramp rather than assuming that a growing advanced-node share must immediately raise margins. These are analytical questions, not claims that management guaranteed the outcomes.
Explore TSMC’s financials on TradingView
Our analysis explains the quarter. TradingView offers a way to explore reported-versus-estimated earnings and the financial-statement interface yourself. Use quarterly periods and check the currency, share class and provider definitions before comparing numbers.
Data source: the accounting figures in this article come from TSMC’s official disclosures. TradingView is linked as a research tool, not used as the source of these figures.
For a practical introduction, see our TradingView review. For another part of the semiconductor industry, read our Micron earnings analysis. Micron and TSMC have different business models; the link is context, not a like-for-like valuation comparison.
What could change this assessment?
The constructive case is that revenue demand remains resilient while new capacity converts into profitable sales and cash. The countercase is that ramp costs, underutilization, currency movements or changes in customer spending offset part of that growth. Neither case is a promised stock-price outcome. The company’s forward-looking statements explicitly carry uncertainty. Release, safe-harbor section.
Earnings FAQ
Was TSMC’s Q3 2026 report good overall?
Our assessment is positive on growth and cash generation, qualified by sequential margin dilution and the need to evaluate the share price separately. That is an interpretation of the reported quarter, not an investment recommendation.
Does this article say TSMC beat analyst estimates?
No. It compares results with the company’s own guidance. A defensible analyst comparison requires a dated, pre-release consensus on the same accounting, currency and share-class basis.
Is TSMC’s Q4 guidance an actual result?
No. Q3 ended September 30; Q4 covers October to December 2026. The guidance range describes management’s expectations, not results already earned.
Methodology: source-led fundamental analysis
We use the TradeProperly five-layer research approach: profitability, cash flow, financial strength, valuation and forward signals. Company disclosures control the accounting figures. Computed metrics are labeled; absent market or consensus inputs are not replaced with guesses. Not every valuation or forward-looking measure is available in this analysis.
AI assisted research and drafting, with source-linked verification and calculation checks. This material is educational, not personalized investment advice or a recommendation to trade. The research date is not a claim that share prices or forecasts remain current.
Call commentary was checked against the Quartr transcript published by Yahoo Finance; the original audio was not independently checked. The SEC-filed release notes that Q3 figures had not yet received board approval. This qualification is not evidence of a correction. SEC release, table footnote a.
Sources
- TSMC earnings release filed with SEC (quarterly table, footnote a)
- Management call: Quartr transcript published by Yahoo Finance (secondary transcription) (00:06:39 margins; 00:07:45 capital budget; 00:20:55–00:23:51 Q&A; 00:48:27 future budgets)
- release: TSMC original disclosure (1-2)
- statements: TSMC original disclosure (1 balance sheet; 2 quarterly income; 3 nine-month income; 4 cash flow and FX notes)
- management: TSMC original disclosure (1 comparison; 2 mix; 3 nonoperating items; 4 liquidity; 5 cash flow)
- presentation: TSMC original disclosure (4 results and ROE definition; 7 balance sheet; 8 cash flow; 9 guidance)
- q424: TSMC original disclosure (1)
- q125: TSMC original disclosure (1)
- q225: TSMC original disclosure (1)
- q425: TSMC original disclosure (1)
- q126: TSMC original disclosure (1)