
Nike Q1 FY2027 earnings show a turnaround that is improving in some places, but is not yet working across the entire business. Revenue fell to $11.213 billion, diluted earnings per share were $0.48, and gross margin rose to 42.8%. North America grew, while Greater China and Nike's direct-to-consumer business continued to contract.
The subsequently filed 10-Q adds an important caution: operating cash flow was $135 million, and free cash flow under our cash-capex definition was negative $64 million. Better gross margin has not yet translated into stronger quarterly cash generation.
Our assessment: margin stabilization is encouraging, but demand recovery and cash conversion remain weak. The next test is whether Nike can rebuild sales and recurring cash generation without relying primarily on cost reductions or one-off benefits.
Nike Q1 FY2027 earnings at a glance
Swipe or scroll sideways to see the full table.
| Metric | Q1 FY2027 | Q1 FY2026 | Change / context |
|---|---|---|---|
| Revenue | $11.213B | $11.720B | -4.3% reported; −5% currency-neutral |
| GAAP diluted EPS | $0.48 | $0.49 | −2% using rounded EPS |
| Net income | $712M | $727M | -2.1% |
| Gross margin | 42.8% | 42.2% | +60 basis points |
| Company EBIT (non-GAAP) | $907M | $904M | Broadly flat |
| Company EBIT margin (non-GAAP) | 8.1% | 7.7% | +40 basis points |
| Nike Direct revenue | $4.142B | $4.514B | −8% reported |
| Greater China revenue | $1.180B | $1.512B | −22% reported; −26% currency-neutral |
| Operating cash flow (10-Q) | $135M | $222M | -39.2% |
| Calculated free cash flow | −$64M | $15M | OCF less cash PP&E additions |
Figures are reported results unless labeled otherwise. Revenue and net-income percentage changes are calculated from Nike's published dollar amounts; currency-neutral growth and company EBIT are non-GAAP measures. Free cash flow is our calculation, not a reported GAAP line item. Sources: Nike's Q1 FY2027 financial schedules, pages 1–5, and the Q1 FY2027 10-Q cash-flow statement, printed page 4.
1. Profitability: better gross margin, weaker demand
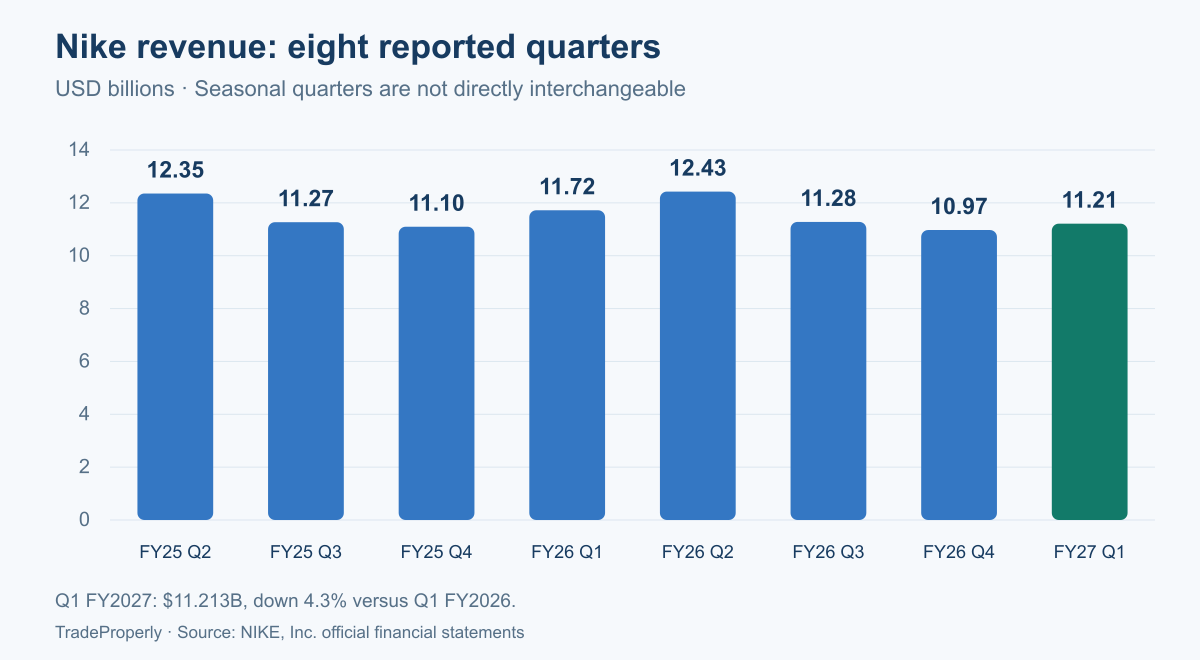
The eight-quarter picture
Swipe or scroll sideways to see the full chart.
Swipe or scroll sideways to see the full table.
| Fiscal quarter | Revenue | Gross margin | Net income | GAAP diluted EPS |
|---|---|---|---|---|
| FY25 Q2 | 12,354 | 43.6% | 1,163 | $0.78 |
| FY25 Q3 | 11,269 | 41.5% | 794 | $0.54 |
| FY25 Q4 | 11,097 | 40.3% | 211 | $0.14 |
| FY26 Q1 | 11,720 | 42.2% | 727 | $0.49 |
| FY26 Q2 | 12,427 | 40.6% | 792 | $0.53 |
| FY26 Q3 | 11,279 | 40.2% | 520 | $0.35 |
| FY26 Q4* | 10,972 | 49.2% | 1,069 | $0.72 |
| FY27 Q1 | 11,213 | 42.8% | 712 | $0.48 |
Comparison warning: FY2026 Q4 included a $986 million tariff-recovery benefit, with a reported $0.52 benefit to diluted EPS. Its 49.2% gross margin and $0.72 EPS are not clean benchmarks for the underlying trend. We have not relabeled those GAAP results as normalized earnings. Source: Nike's FY2026 fourth-quarter release.
The more useful starting comparison is with the same quarter a year earlier. Gross margin increased 60 basis points, from 42.2% to 42.8%. However, lower revenue meant gross profit still fell, from $4.943 billion to $4.798 billion.
SG&A declined by $106 million, to $3.910 billion. Within that total, operating overhead fell by $170 million, while demand-creation spending increased by $64 million. Nike is cutting overhead while maintaining spending intended to support the brand and product pipeline.
There is an important distinction between margin improvement and operating recovery. Gross profit less SG&A fell from $927 million to $888 million, our simple calculation excluding interest and other income or expense. Nike's company-defined EBIT was broadly flat at $907 million, helped by the change in other income or expense. This is why flat EBIT alone does not establish that core trading conditions have recovered. Nike labels EBIT a non-GAAP measure; it is not presented here as GAAP operating income. Source: financial schedules, pages 1 and 5.
China and Nike Direct remain the pressure points
Swipe or scroll sideways to see the full table.
| Region | Q1 FY2027 | Q1 FY2026 | Reported YoY | Currency-neutral YoY |
|---|---|---|---|---|
| North America | 5,127 | 5,020 | +2% | +2% |
| EMEA | 3,176 | 3,331 | -5% | -5% |
| Greater China | 1,180 | 1,512 | -22% | -26% |
| Asia Pacific & Latin America | 1,463 | 1,490 | -2% | 0% |
Greater China revenue declined by $332 million. That amount equals roughly 65% of the $507 million net decline in consolidated revenue, an arithmetic comparison rather than proof that China alone caused the weakness. Growth in North America partially offset declines elsewhere.
Nike Direct revenue fell 8% on a reported basis, to $4.142 billion. Digital sales declined 13% and Nike-owned stores declined 5%. Wholesale revenue fell 1%, to $6.804 billion. These are NIKE Brand channel figures, not a decomposition of total consolidated revenue, which also includes Converse and other items. Converse revenue fell 28%, to $263 million. Source: financial schedules, pages 3–4.
Interpretation: North America's return to growth is a positive signal. It is not yet enough to offset weakness in China, digital distribution and Converse. A stronger turnaround would include improving customer demand in several regions and channels at the same time.
2. Valuation: why the earnings denominator matters
Nike reported $2.10 in GAAP diluted EPS for FY2026, but that year included the fourth-quarter tariff-recovery benefit. Management's FY2027 adjusted EPS outlook of $1.15–$1.35 uses a different basis and excludes an estimated $0.15 per-share impact from the Pace restructuring program.
Those figures should not be treated as directly interchangeable. A valuation based only on historical GAAP EPS could look more attractive because of a non-recurring benefit. A valuation based on management's adjusted outlook depends on forecasts being achieved and leaves out specified restructuring costs.
A dated market snapshot, not a live valuation
Nike closed the regular session on October 2, 2026, at $33.87, down 3.64% from the October 1 close of $35.15. This is the first completed regular session following the results release. It is not a Saturday trading price or an after-hours quotation. The two dated daily historical tables agree on the closing prices. Sources: Stock Analysis and Investing.com.
Swipe or scroll sideways to see the full table.
| Earnings basis | EPS denominator | Calculated price / EPS | Important limitation |
|---|---|---|---|
| FY2026 reported GAAP EPS | $2.10 | 16.1× | Historical fiscal year, not TTM; includes tariff benefit |
| FY2027 adjusted guidance: low end | $1.15 | 29.5× | Management forecast; excludes stated Pace costs |
| FY2027 adjusted guidance: high end | $1.35 | 25.1× | Management forecast; excludes stated Pace costs |
These multiples are our calculations, using the same dated share price. The historical figure uses the completed FY2026 fiscal year's EPS; it is not a trailing-twelve-month P/E. The forward figures use management's adjusted outlook, not analyst consensus, and do not represent a guaranteed earnings outcome. Different reporting periods, the tariff benefit in historical earnings and excluded restructuring costs prevent a clean like-for-like comparison.
At this snapshot, the forward adjusted range is approximately 25.1–29.5 times earnings. That helps explain why a lower stock price does not automatically imply a low earnings multiple: the expected earnings denominator has also weakened. We assign neither a price target nor a buy or sell rating.
Interpretation: a falling share price does not, by itself, make Nike inexpensive. The central question is how much recurring earnings power survives the reset and how quickly it can recover. Sources: FY2026 annual report and FY2027 outlook in the results release.
3. Cash flow: the new 10-Q adds a warning
The Q1 FY2027 10-Q, filed October 2, provides the current-quarter cash-flow statement that was absent from the initial earnings schedules. The figures below compare the same three-month period a year earlier.
Swipe or scroll sideways to see the full table.
| Metric | Q1 FY2027 (2026) | Q1 FY2026 (2025) | Basis / context |
|---|---|---|---|
| Operating cash flow | 135 | 222 | Reported in 10-Q |
| Cash PP&E additions | 199 | 207 | Cash expenditure, positive amounts shown |
| Calculated free cash flow | -64 | 15 | Operating cash flow minus cash PP&E additions |
| Cash dividends | 610 | 591 | Cash paid, not merely dividends declared |
Operating cash flow declined approximately 39.2%, from $222 million to $135 million. Cash additions to property, plant and equipment were $199 million, producing negative $64 million of calculated free cash flow, versus positive $15 million a year earlier. Cash dividends were $610 million. Source: Q1 FY2027 Form 10-Q, cash-flow statement, printed page 4.
Our free-cash-flow definition is operating cash flow minus cash additions to property, plant and equipment. It excludes the separately disclosed $225 million of non-cash PP&E additions and is not a subtraction of total investing cash flow. It is an author-calculated non-GAAP measure, not a separate GAAP line item.
Why profit and cash diverged
Nike reconciles the $135 million operating inflow as $712 million of net income plus $269 million of non-cash adjustments, less $846 million of working-capital and other changes. Its explanation points to employee-related payments, inventories and tax payments, partly offset by receivables collections.
The quarter converted about 19% of net income into operating cash flow, our calculation. That is a warning about this quarter's cash conversion, not a forecast that the same ratio will persist all year. Seasonal working-capital movements matter; the prior-year quarter also had relatively low cash generation. Nevertheless, the same-quarter comparison has weakened rather than improved. Source: 10-Q, liquidity discussion, printed page 33.
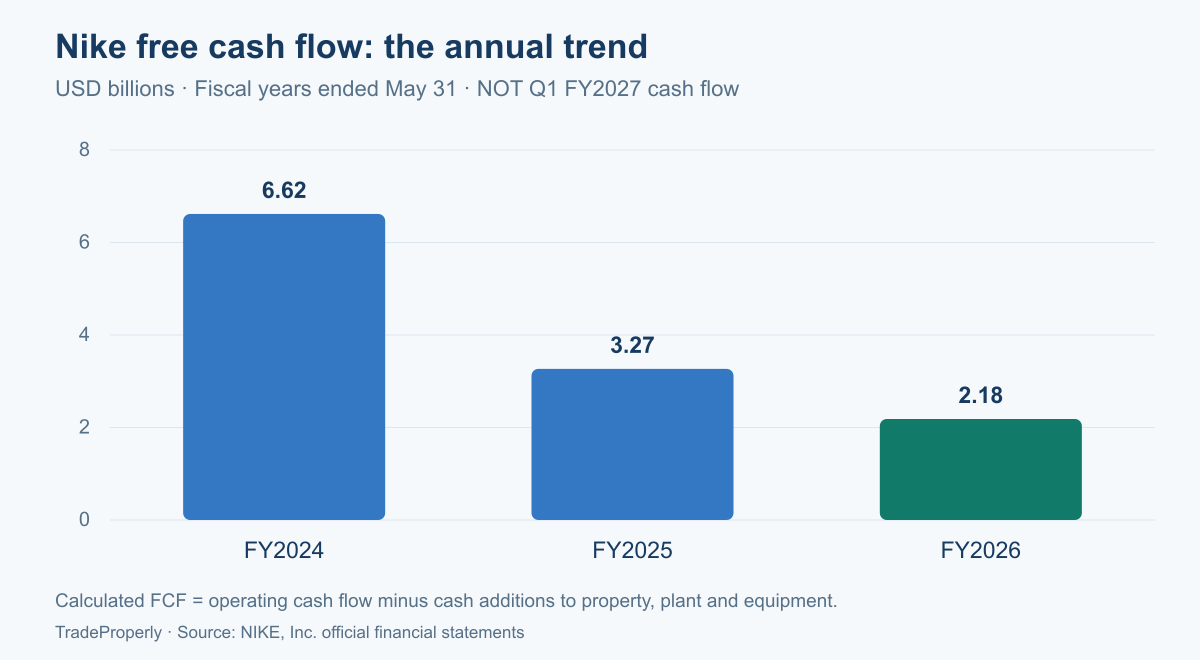
Annual context: a separate reporting period
The next chart and table cover completed fiscal years, not the latest quarter. They show why quarterly cash generation deserves attention beyond a single seasonal period.
Swipe or scroll sideways to see the full chart.
Swipe or scroll sideways to see the full table.
| Fiscal year | Operating cash flow | Cash capex | Calculated FCF | Cash dividends |
|---|---|---|---|---|
| FY2024 | 7,429 | 812 | 6,617 | 2,169 |
| FY2025 | 3,698 | 430 | 3,268 | 2,300 |
| FY2026 | 2,868 | 684 | 2,184 | 2,407 |
Using the same cash-capex definition, FY2026 free cash flow was $2.184 billion, down approximately 33.2% from FY2025, and equivalent to 4.7% of revenue. This definition does not deduct acquisitions or every form of investing expenditure.
FY2026 cash dividends of $2.407 billion exceeded this measure of free cash flow by $223 million. That does not establish that the dividend is immediately unsustainable: Nike also has liquidity and access to financing. It does show that recurring cash generation and shareholder distributions should be assessed together. Source: FY2026 Form 10-K, cash-flow statement, printed page 58.
Do not mistake a tariff refund for a sales recovery
Nike recognized a $986 million tariff-recovery benefit in FY2026. Its annual report says $302 million had been received in cash by year-end, leaving a $684 million receivable, and that substantially all the remaining amount was received after May 31.
The new 10-Q explicitly links the current-quarter receivables decrease to collection of the tariff receivable and the tax-payable decrease to its related US federal tax payment. The refund is not evidence of stronger customer demand, and operating cash flow was still modest after all reported movements. We have not invented a refund-free or after-tax adjusted cash-flow figure: isolating those paired effects requires a sufficiently detailed cash reconciliation. Sources: annual report, printed page 30, and Q1 10-Q, printed page 33.
4. Financial health: liquidity is meaningful, not unlimited
Swipe or scroll sideways to see the full table.
| Metric | Amount | Definition / context |
|---|---|---|
| Cash and equivalents | 6,903 | Reported balance |
| Short-term investments | 1,465 | Reported balance |
| Cash plus short-term investments | 8,368 | Our sum |
| Current portion of long-term debt | 2,000 | Within current liabilities |
| Long-term debt | 5,893 | Excludes current portion |
| Operating-lease liabilities | 3,179 | Our sum of current and long-term portions |
| Current assets / current liabilities | 23,673 / 11,409 | Current ratio: 2.07 |
| Inventories | 7,846 | Prior year: 8,114 |
Cash and short-term investments total $8.368 billion, compared with $7.893 billion of the current portion of long-term debt plus long-term debt. That leaves $475 million of net cash before operating-lease liabilities. Including $3.179 billion of reported lease liabilities changes the picture materially. Nike should not be described as debt-free.
The current ratio is 2.07, calculated as current assets divided by current liabilities. It is a liquidity snapshot, not a guarantee: current assets include inventory and receivables, not just immediately available cash. The $2 billion current portion of long-term debt also deserves monitoring alongside operating cash generation.
Inventories were $7.846 billion, about 3% below the prior-year level. However, they were $345 million, or approximately 4.6%, above May 31's $7.501 billion. Both comparisons matter: “down year over year” does not mean inventory continued to fall during the quarter. Seasonality and product mix prevent us from treating the sequential increase as proof of an inventory crisis.
Cash plus short-term investments also declined from $9.027 billion at May 31 to $8.368 billion at August 31. Nike retains meaningful liquidity, but its cash cushion is not growing during this reset. Sources: Q1 financial schedules, page 2, and 10-Q balance sheet, printed page 3.
5. Forward signals: Pace is a plan, not a completed recovery
Management expects FY2027 revenue to decline by a high-single-digit percentage and adjusted diluted EPS of $1.15–$1.35, excluding approximately $0.15 of Pace-related impact. These are company projections, not reported results or an independently verified analyst consensus.
Pace targets approximately $2.5 billion of cumulative savings through FY2031, with around $1 billion of additional pre-tax charges through FY2031, including approximately $300 million in FY2027. “Cumulative” is important: this is not a promise of $2.5 billion in annual recurring savings. The release describes the additional charges separately from the approximately $300 million of FY2026 severance connected with the program. Source: results release and Pace disclosure.
The company-hosted unofficial earnings-call transcript also indicates that much of the savings is expected later in the program and that some will be reinvested. This supports a cautious reading: restructuring takes time and does not automatically solve product demand. Source: management's prepared remarks.
The next-quarter checklist
Swipe or scroll sideways to see the full table.
| Signal to monitor | Evidence that would strengthen the turnaround | Evidence that would weaken it |
|---|---|---|
| Demand | North America growth sustained; China declines narrow | Weakness spreads across regions |
| Distribution | Nike Direct and digital sales stabilize | Direct sales keep shrinking despite spending |
| Profitability | Margin gains supported by sales and gross profit | Revenue erosion absorbs cost savings |
| Cash generation | Operating cash improves beyond refund receipts | Cash improvement depends on one-off collections |
| Pace execution | Disclosed savings and charges track the plan | Charges rise or benefits shift further out |
These are monitoring criteria, not forecasts. The same-quarter comparison is preferable to assuming that seasonal sequential changes represent an acceleration or slowdown.
Bottom line: stabilization is not the same as a turnaround
Nike's Q1 FY2027 report contains genuine positives: North America grew, gross margin improved and overhead fell. But consolidated revenue declined, China and Nike Direct remained weak, and management's full-year outlook still implies contraction.
The new 10-Q reinforces that caution: calculated quarterly free cash flow turned negative, and inventories increased from fiscal year-end despite falling year over year. The post-release closing-price decline is a market observation, not independent proof that every aspect of the business deteriorated.
Our conclusion is early margin stabilization, not a confirmed demand-led recovery. The next useful evidence will be better same-quarter cash conversion, progress in China and digital sales, and profitability that improves without unusual benefits. We are not assigning a buy or sell rating.
For more examples of the same research approach, read our Costco Q4 FY2026 earnings analysis and Micron Q4 FY2026 earnings analysis, or browse the earnings-analysis archive. These are separate company analyses, not like-for-like valuation peers for Nike.
Nike earnings FAQ
What were Nike's Q1 FY2027 revenue and EPS?
Revenue was $11.213 billion and GAAP diluted EPS was $0.48 for the quarter ended August 31, 2026. Both were below the same quarter a year earlier.
Did Nike's gross margin improve?
Yes. Gross margin rose from 42.2% to 42.8% year over year, a 60-basis-point increase. Dollar gross profit nevertheless declined because revenue fell.
Why is Greater China important to this report?
Greater China revenue fell 22% on a reported basis and 26% on a currency-neutral basis. Its $332 million revenue decline was a large part of the net consolidated decline, while North America grew.
What is Nike's FY2027 earnings outlook?
Management projects adjusted diluted EPS of $1.15–$1.35, excluding approximately $0.15 per share of Pace-related impact, alongside a high-single-digit revenue decline. The adjusted outlook is not the same measure as historical GAAP EPS.
Was Nike's Q1 FY2027 free cash flow positive?
No under the definition used here. Operating cash flow of $135 million minus cash PP&E additions of $199 million gives negative $64 million. The same calculation was positive $15 million in the prior-year quarter. These are quarterly values, separate from the annual cash-flow history.
Is Nike's turnaround complete?
Not on the evidence in this quarter. Better gross margin and overhead control coexist with declining sales in several important parts of the business. Broader demand recovery and recurring cash generation remain key tests.
Sources and methodology
Our fundamental review covers five areas: profitability, valuation, cash flow, financial health and forward signals. We separate reported financial results, management projections and our own calculations. Dollar amounts are USD; financial tables use millions unless otherwise stated. Percentages may differ slightly from company-rounded changes.
The quarterly schedules and 10-Q financial statements are unaudited. The annual cash-flow history comes from Nike's audited FY2026 annual financial statements. The call transcript is company-hosted but explicitly labeled unofficial, and is used only for management commentary. Market prices are a dated regular-session snapshot, not a live feed. We do not imply that a full 26-check model, peer valuation or analyst-consensus comparison has been completed.
Primary sources:
- Q1 FY2027 financial schedules: income statement, balance sheet, geographic and channel revenue, and non-GAAP EBIT.
- Q1 FY2027 Form 10-Q, filed October 2, 2026: current-quarter cash flow, working-capital explanation and the fiscal-year-end balance-sheet comparison.
- Q1 FY2027 results release: results announcement, full-year outlook and Pace program.
- FY2026 annual report / Form 10-K: historical annual cash flow, EPS and tariff-recovery accounting.
- FY2026 Q2 release, FY2026 Q3 release, and FY2026 Q4 release: quarterly history and prior-year comparative figures.
- Company-hosted unofficial call transcript: management's prepared remarks.
- Nike's filing register: follow-up source for the latest quarterly filing.
- Stock Analysis historical prices and Investing.com historical prices: the October 2 and October 1 regular-session closing-price rows.
Disclosure: This article is for information and education, not personalized investment advice. Forecasts can change, and historical results do not guarantee future performance. No affiliate links have been added to this analysis.