
As September is approaching investors would need to be prepared for a special month, since as the headline  states:”September – is the worst month for stocks – and the best for the Gold”
This was tested by statisticians that found a pattern for this month in a probability ratio of 90% – https://www.marketwatch.com/story/bulls-could-finally-take-a-shine-to-gold-in-september-2018-08-30
In average the Gold produced a yield of 2% during September = 24$-25$ movement.
While the month is knocking the Gold went through a rough month, after dropping during August by 5.1% and in the last days of the month corrected most of it – and now facing the best month in the year for him?? – what do you think will happen?
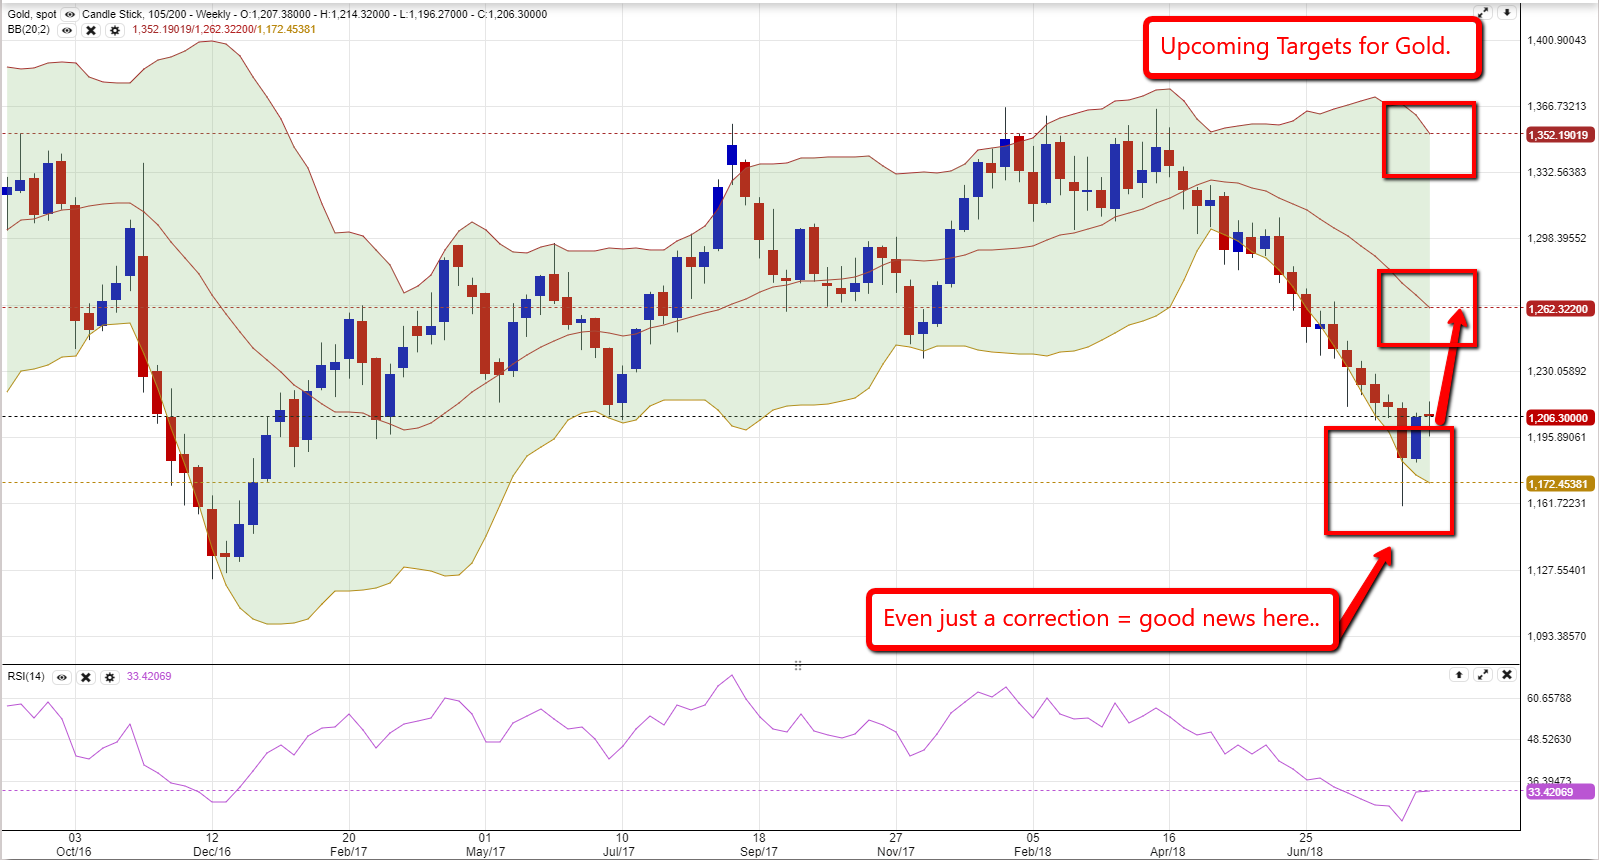
A long-term perspective on Gold:
Looking backward it appeared as if the Gold will break the support trend line of 1,194$ per ounce – but no…
The Gold pushed up towards the end of the month and is in a perfect position to test the previous resistance level at 1,356$ = a movement of 150$.

Share your opinion below and stay Tuned – more to come…
