
Apple Inc., the tech behemoth known for its innovative products and services, has always been a focal point for investors and market analysts. Let’s delve into Apple stock performance and what the future might hold for this tech giant.
1. Recent Apple Stock Performance
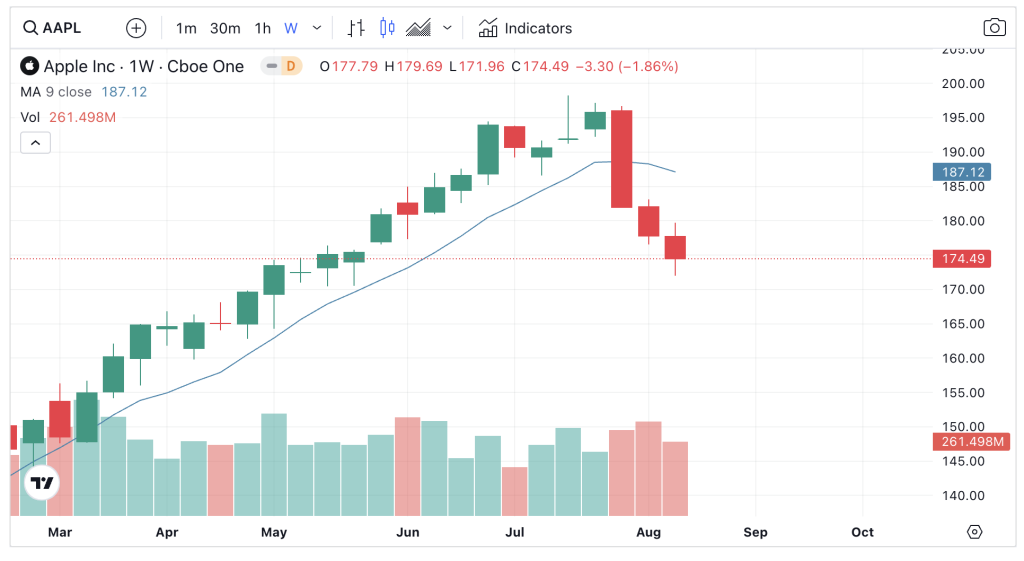
As of the latest update, Apple stock price stands at $174.68. Over the past six months, the stock has seen significant fluctuations, starting the year at $130.28 and reaching a high of $194.48. The stock closed at $193.97 at the end of the first half of the year and has since adjusted to its current price. The stock has witnessed a volume of over 6.02 billion shares traded in the past six months.
2. Apple Market News and Developments
- Apple Watch as a Necessity: A recent article from MarketWatch highlighted the increasing importance of the Apple Watch, especially for children. The device is being viewed as a safe gadget for kids in an era where online safety concerns are paramount. Moreover, its price point is lower than the iPhone, making it more accessible.
- Tech Stocks and Bonds: Another article pointed out that while tech stocks like Apple are undergoing corrections, their bonds are still being purchased by investors, indicating trust in the long-term prospects of these companies.
3. Future Outlook
Apple’s stock performance is often influenced by its product launches, technological advancements, and market strategies. With the continuous evolution of technology and consumer preferences, Apple is expected to introduce innovative products and services to maintain its market dominance. The company’s focus on privacy, sustainability, and user experience will play a pivotal role in shaping its future stock performance.
4. Moving Average Analysis for Apple Stock
The moving average is a widely used technical indicator that helps smooth out price data by creating a constantly updated average price. It can provide insights into potential future stock price movements. For Apple Inc., we will analyze the 50-day moving average.
50-Day Moving Average
Over the past six months, Apple’s stock has shown the following trends in its 50-day moving average:
- January: The stock started the year at $130.28 and reached a high of $157.38, with an average price of $141.87.
- February: The stock opened at $150.2 and reached a high of $166.84, with an average price of $154.99.
- March: The stock opened at $162.35 and reached a high of $178.99, with an average price of $169.61.
- April: The stock opened at $177.32 and reached a high of $198.23, with an average price of $186.02.
- May to Mid-August: The stock opened at $195.09 and reached a high of $197.2, with an average price of $185.30.
From the above data, it’s evident that Apple’s stock has been on an upward trajectory, with the 50-day moving average consistently rising over the past few months. This indicates a bullish trend for the stock. However, as with all technical indicators, it’s essential to consider other factors and not rely solely on the moving average for investment decisions.
Click here to learn more about how to use a Moving Average
Note: The moving average values are based on the volume-weighted average price for each month.
4. Conclusion
Apple Inc. remains a significant player in the tech industry, with its stock performance reflecting its market strategies and product innovations. While the stock has seen fluctuations in the recent past, the company’s long-term prospects look promising. Investors and market analysts will be keenly watching Apple’s moves in the coming months to gauge its market trajectory.
Disclaimer: This article is for informational purposes only and does not constitute financial advice. Always conduct your research before making any investment decisions.
