
AMD’s Q3 2026 earnings show a business scaling quickly around Data Center demand. The harder question is how much cash that expansion produces. Our assessment: operating momentum strengthened, while cash conversion and customer warrant accounting deserve closer attention.
AMD Q3 2026 earnings at a glance
| Metric | Q3 2026 | Q3 2025 |
|---|---|---|
| Revenue | 13,377 | 9,246 |
| GAAP operating income | 2,832 | 1,270 |
| GAAP diluted EPS | $1.46 | $0.75 |
| Non-GAAP diluted EPS | $2.09 | $1.20 |
| Non-GAAP gross margin | 56% | 54% |
Q3 revenue exceeded the top of AMD’s prior $12.7 billion to $13.3 billion guidance range. That comparison uses the company’s August outlook, not analyst consensus. The earlier guidance also called for a 56% adjusted gross margin, matching the rounded reported result. Prior company outlook.
1. Profitability: the growth engine is changing
| Segment | Revenue | YoY change | Segment operating profit |
|---|---|---|---|
| Data Center | 8,546 | 96.9% | 2,882 |
| Client and Gaming | 3,722 | -8.1% | 573 |
| Embedded | 1,109 | 29.4% | 453 |
Data Center contributed about 64% of group sales. Client and Gaming moved in the opposite direction, while Embedded improved. The reported segment operating profits exclude costs allocated to All Other, so adding them is not the same as consolidated GAAP operating profit. AMD presentation, slides 12 to 16.
For readers, the question is whether the largest business can keep expanding without making the whole company more dependent on a narrow deployment cycle. A strong segment can outweigh weakness elsewhere, but that does not make the weakness disappear.
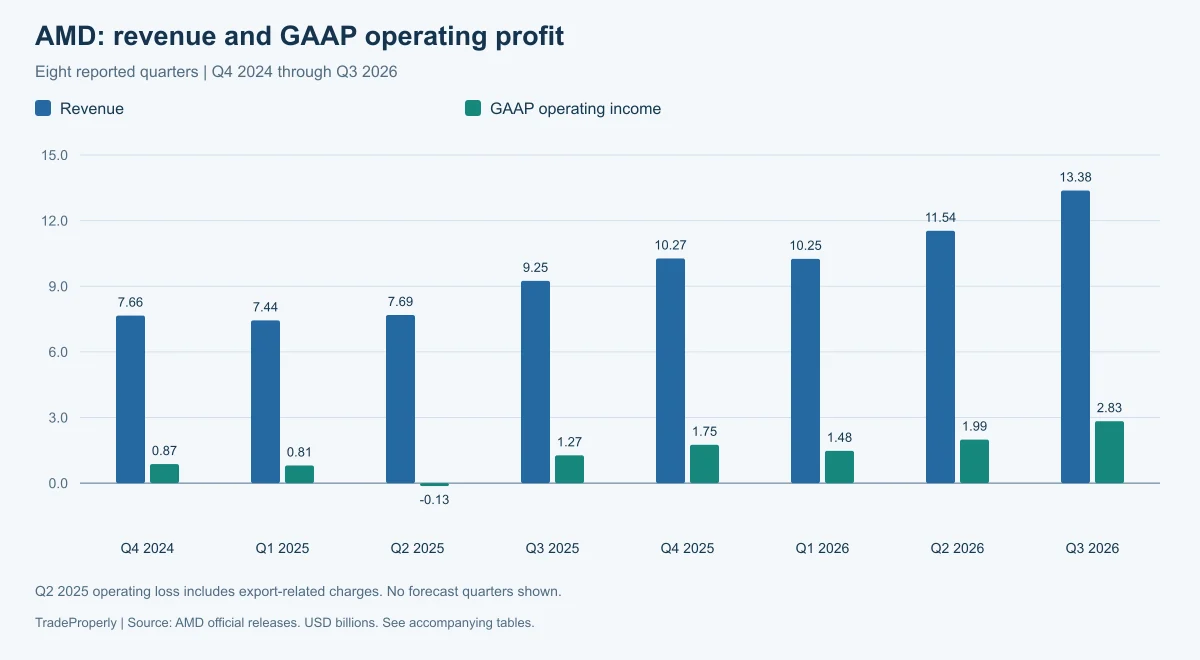
| Quarter / period end | Revenue | GAAP operating profit | GAAP net income | Diluted EPS |
|---|---|---|---|---|
| Q4 2024 / 2024-12-28 | 7,658 | 871 | 482 | 0.29 |
| Q1 2025 / 2025-03-29 | 7,438 | 806 | 709 | 0.44 |
| Q2 2025 / 2025-06-28 | 7,685 | -134 | 872 | 0.54 |
| Q3 2025 / 2025-09-27 | 9,246 | 1,270 | 1,243 | 0.75 |
| Q4 2025 / 2025-12-27 | 10,270 | 1,752 | 1,511 | 0.92 |
| Q1 2026 / 2026-03-28 | 10,253 | 1,476 | 1,383 | 0.84 |
| Q2 2026 / 2026-06-27 | 11,536 | 1,990 | 2,297 | 1.38 |
| Q3 2026 / 2026-09-26 | 13,377 | 2,832 | 2,428 | 1.46 |
The history provides context for the latest acceleration. These are actual quarters, with period ends shown explicitly. GAAP net income and EPS can include discontinued operations and tax effects; they are not normalized earnings. Q2 2025 operating profit was affected by MI308 export restrictions and related inventory charges. Q2 2025 disclosure.
Why GAAP and adjusted earnings tell different stories
The operating profit reconciliation adds back $523 million of stock compensation, $534 million of acquired intangible amortization, $27 million of acquisition and other costs, and $7 million of legal contingencies. Together, these bridge $2.832 billion of GAAP operating income to $3.923 billion adjusted. AMD reconciliation.
Below operating profit, the quarter includes a $1.097 billion warrant remeasurement expense and a $555 million income tax benefit. Customer warrants also have grant-date accounting that can reduce qualifying revenue, and can create dilution if conditions are met. The noncash remeasurement expense is not the same as cash paid out or shares already issued. Form 10-Q, Notes 3, 13 and 14.
At September 26, no warrant shares had vested or become exercisable. AMD’s filing distinguishes the reduction of qualifying revenue from subsequent liability remeasurement, and includes warrant shares in EPS once they become vested and exercisable. We do not treat the maximum contractual share count as dilution already incurred. Form 10-Q, accounting policy and Note 14.
Our interpretation: use operating performance to assess the business, but keep both accounting bases visible. Stock compensation, tax effects and customer incentives each answer a different question; removing an item from adjusted earnings does not remove its economic implications.
2. Cash flow: the most important counterweight
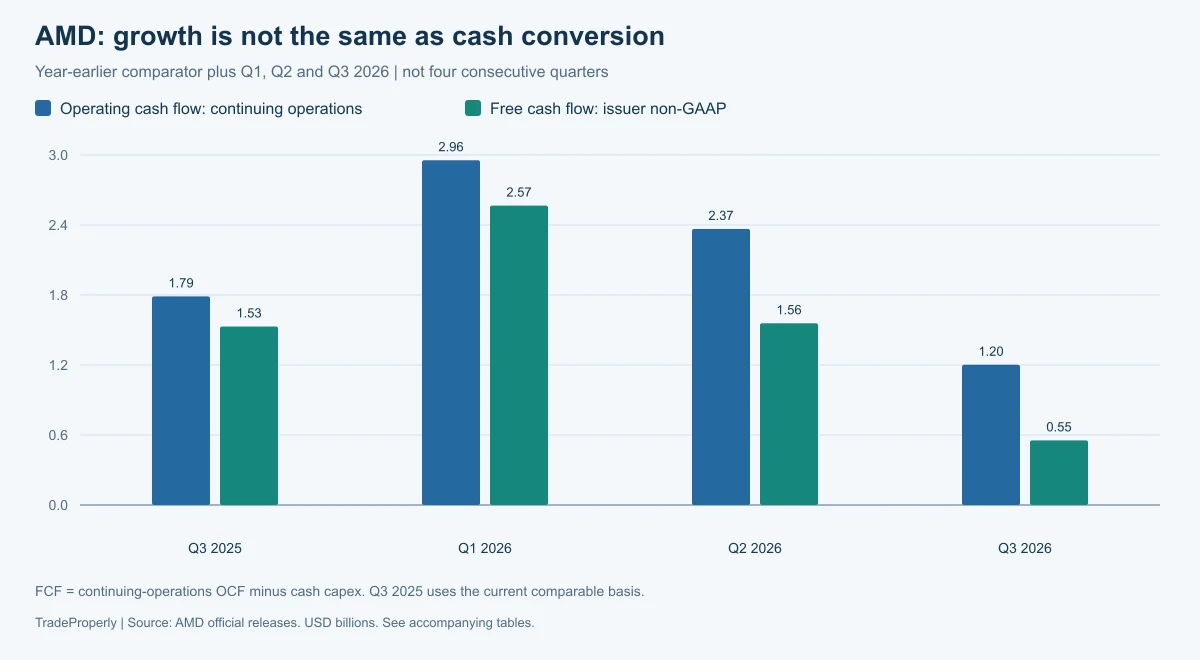
| Quarter | Operating cash flow | Cash capex | Free cash flow |
|---|---|---|---|
| Q3 2025 | 1,788 | 258 | 1,530 |
| Q1 2026 | 2,955 | 389 | 2,566 |
| Q2 2026 | 2,366 | 808 | 1,558 |
| Q3 2026 | 1,202 | 648 | 554 |
Quarterly free cash flow fell about 64% from a year earlier and from Q2. It represented roughly 4.1% of revenue. The issuer’s calculation uses operating cash flow from continuing operations minus cash purchases of property and equipment. Using total 2025 operating cash flow, which included the divested manufacturing business, would give a different comparison.
The three 2026 quarters sum to $4.678 billion of FCF, agreeing with the nine-month reconciliation. This distinction matters: a nine-month total should never be presented as a single-quarter result. Q1 cash reconciliation; Q3 cash reconciliation.
On the call, CFO Jean Hu attributed cash pressure to working capital and capacity investment, linking the roughly $3 billion sequential inventory increase to Data Center demand. Further investment was expected. These selected remarks were checked against a third-party transcript, CFO balance sheet discussion; original audio was not independently verified.
That explanation is plausible as a growth investment thesis, but it is not proof that collections will catch up. A useful next-quarter test is whether cash generation improves as products ship, without relying on progressively larger supplier financing or inventory balances.
3. Financial strength: liquidity comes with commitments
| Measure | Q3 2026 | Q2 2026 |
|---|---|---|
| Cash, equivalents and short-term investments | 15,776 | 13,111 |
| Debt carrying amount | 7,079 | 3,226 |
| Receivables, net | 9,209 | 7,281 |
| Inventory | 11,463 | 8,468 |
Liquid assets exceeded the debt carrying amount by approximately $8.70 billion. That calculation includes short-term investments; it should not be described as cash alone. The rising cash balance also came alongside new borrowing, so it is not evidence by itself of stronger internally generated cash. AMD balance sheet presentation, slide 13.
The filing explains that inventory, receivables and supply prepayments absorbed cash during the first nine months, partly offset by payables. Those are cumulative movements, not all Q3 movements. Form 10-Q, Financial Condition.
The practical follow-up is to watch collections and inventory against sales. More liquidity offers flexibility, but it does not establish the return on inventory, capacity commitments or acquisitions. We do not assign a ROIC or WACC figure without a consistent capital definition and explicit assumptions.
4. Forward signals: what the Q4 outlook requires
| Metric | Outlook |
|---|---|
| Revenue midpoint | $17.00 billion |
| Revenue range: calculated | $16.49 billion to $17.51 billion |
| Non-GAAP gross margin | Approximately 55% |
The revenue range is calculated from management’s midpoint and percentage band. These are forecasts issued November 3, not reported Q4 results. The gross margin outlook uses an adjusted basis and should be compared with the same basis in Q3. AMD outlook.
Management’s explanation of the outlook
Management forecast roughly 50% sequential Data Center growth and a decline exceeding 20% in Client and Gaming. In Q&A, Hu linked lower gross margin to a larger AI revenue mix, without establishing that the pressure would be temporary. Lisa Su described demand exceeding supply. These are management expectations, not independently verified orders. Published transcript: CFO outlook and Q&A with Buchalter and O’Malley.
Our interpretation: the outlook requires both a substantial shipment ramp and sufficient components and customer infrastructure. A lower gross margin percentage can coexist with rising gross profit dollars; it does not establish how long margin pressure will last.
For the next update, we would prioritize four checks:
- Does revenue reach the range, and which segment accounts for the change?
- Does margin hold up as the mix shifts toward larger systems?
- Do inventory and receivables convert into cash?
- How do customer incentives affect reported revenue, earnings and the share count?
Execution matters more than a product announcement count. Delivery schedules, component availability, customer infrastructure and end demand can each change the timing between an attractive pipeline and cash receipts.
5. Valuation context: strong results are one part of the decision
This review evaluates the reported business performance. It does not assign a current P/E, fair value or price target: a dated share price and comparable earnings assumptions are needed for those calculations. Nor does it claim an analyst earnings beat without an archived estimate from before the release.
The evidence supports a clear operating conclusion: growth accelerated, and the central uncertainty is the cash and capital required to sustain it. That conclusion alone does not tell us what price is attractive for the stock.
TradingView is useful for navigating the history and estimates. Match the ticker, fiscal quarter, units and accounting basis before comparing figures, and return to the issuer’s filing for definitions. Our earnings report checklist explains the process.
How this connects to the semiconductor research
Read our TSMC Q3 2026 analysis and Micron Q4 FY2026 analysis for separate perspectives on manufacturing and memory. Their fiscal periods, business models and capital intensity differ. Treat them as related case studies rather than a directly comparable valuation peer set.
AMD earnings: common questions
Was AMD’s Q3 2026 report strong?
Revenue and operating profit improved substantially. Quarterly cash generation weakened. We view the operating result favorably while keeping cash conversion as the main test for the next report.
Why is AMD’s adjusted EPS different from GAAP EPS?
AMD removes specified items under its non-GAAP definition, including stock compensation, acquired intangible amortization and warrant remeasurement, with tax adjustments. Read the reconciliation rather than treating the two EPS figures as interchangeable.
Does the Q4 outlook mean those results have already happened?
No. The outlook is management’s forecast. The historical tables stop at Q3 2026; Q4 appears only in the outlook section.
Methodology and sources
We examine profitability, valuation context, cash flow, financial strength and forward signals. Tables and charts share one data file; derived percentages use the displayed underlying USD million figures. Cash comparisons use continuing operations. Original company releases supply the historical table; current release comparisons and the filed 10-Q supply the latest checks. This is a focused earnings review, not a complete valuation model.
- Q4 2024 release
- Q1 2025 release
- Q2 2025 release
- Q3 2025 release
- Q4 2025 release
- Q1 2026 release
- Q2 2026 release and prior guidance
- Q3 2026 release and reconciliations
- Q3 2026 filed Form 10-Q
- Q3 2026 earnings presentation
- Selected management remarks: Stock Analysis transcript (third party)
Educational information only. This article is not investment advice or a recommendation to buy or sell securities. Company outlooks are uncertain and reflect their stated issue date.