
TrendSpider makes the most sense when you run the same research routine repeatedly: scan a list of stocks, monitor a setup, and test the rule on historical data. Its visual builders give each step a place in the same platform. If you mainly draw charts and occasionally set a price alert, a paid subscription is harder to justify.
Affiliate disclosure: TradeProperly may earn a commission if you buy through our TrendSpider link.
TrendSpider provided 30 days of free access for this review. We used a separate built-in template for each tool. The examples differ in symbols, moving-average periods and timeframes.
Start with a scan you can explain
We opened the built-in bullish SMA (20) vs. EMA (50) scanner and ran it on the Dow Jones 30. The rule looked for the 20-day simple moving average crossing above the 50-day exponential moving average on daily candles. Extended-hours data and the open candle were excluded. The run returned zero matches.
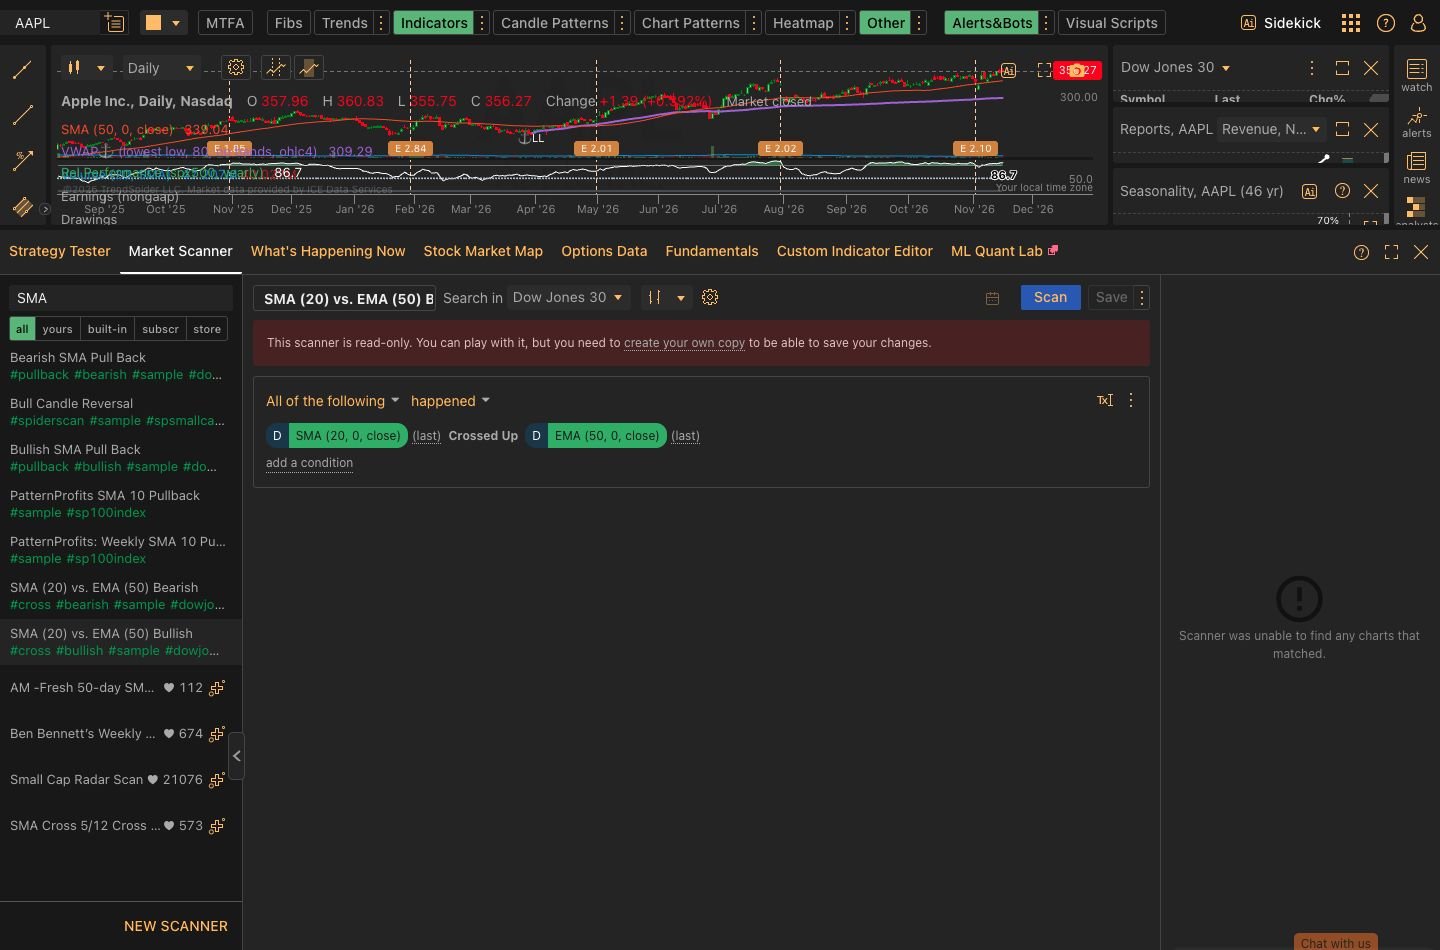
A crossover asks whether the relationship changed on a bar. An above-average condition can return a stock that has met it for weeks. The template displayed the two moving averages and the crossover operator together, making it easy to check the rule before running the scan. Market Scanner documentation.
Configure a multi-factor alert on AAPL
We opened the Multi-Factor Alert builder on AAPL and loaded the built-in 10/50 EMA Cross Up visual script. This template used hourly candles. With extended hours off, the builder explained that it would evaluate the condition at each hourly candle close during the regular session. The form also showed a ten-day expiry and a one-trigger setting. We closed the form before creating the alert, so delivery was outside this test.
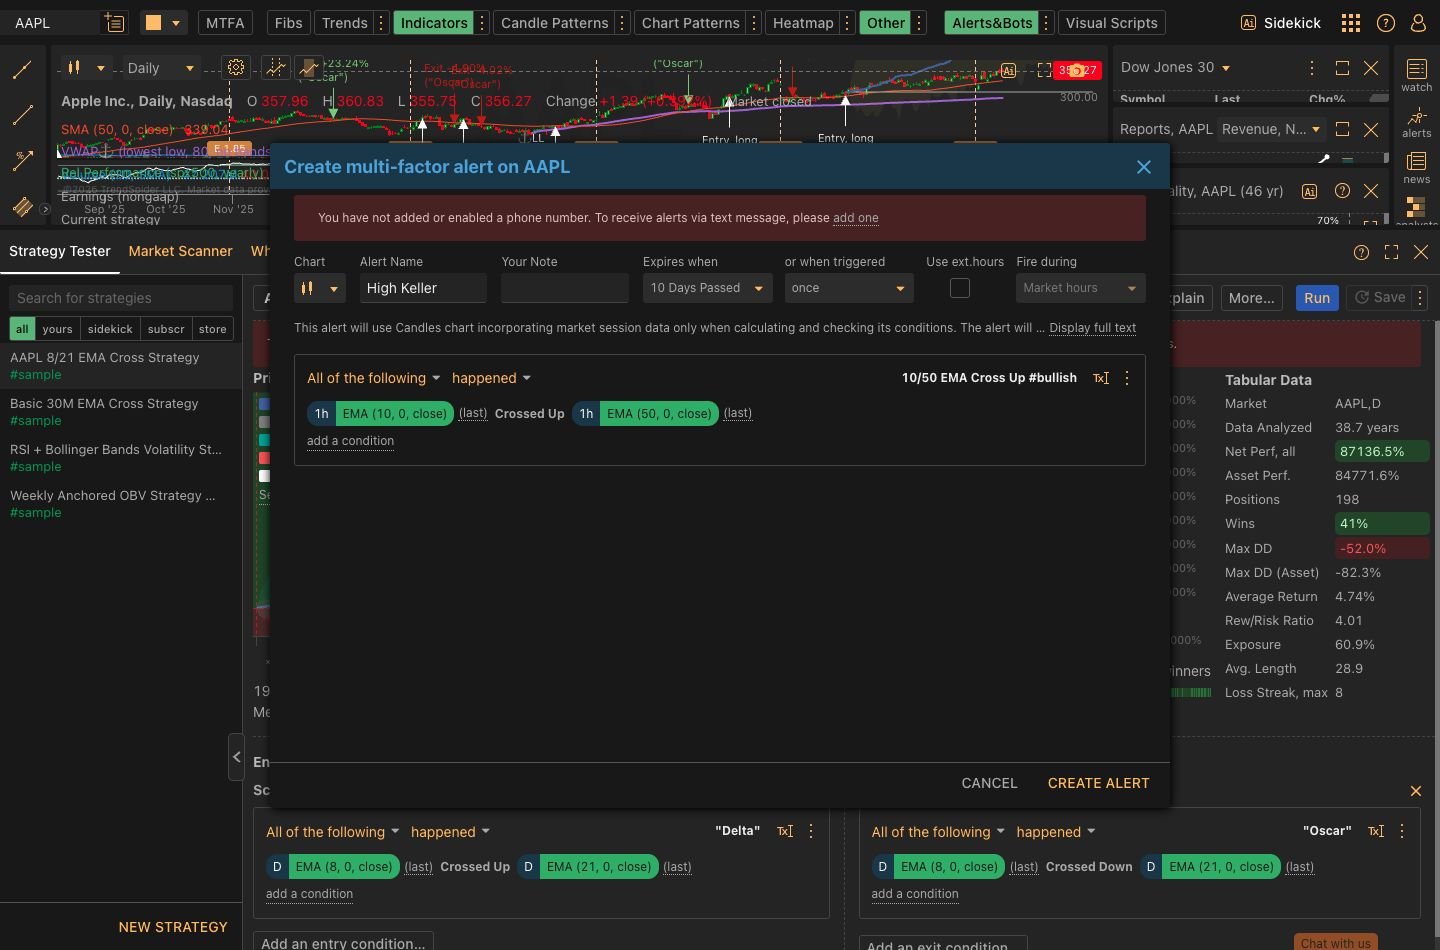
Check the timeframe shown beside each condition after loading a template. The chart can be set to daily while the script still evaluates hourly candles. Alerts documentation.
Backtest a daily crossover on AAPL
In Strategy Tester we ran TrendSpider’s built-in AAPL 8/21 EMA Cross Strategy on daily candles. It enters long when the 8-day EMA crosses above the 21-day EMA and exits on a cross below. The execution setting showed Next Open and trade cost was 0%. In the run shown below, the platform displayed 198 positions analyzed and a maximum strategy drawdown of 52%.
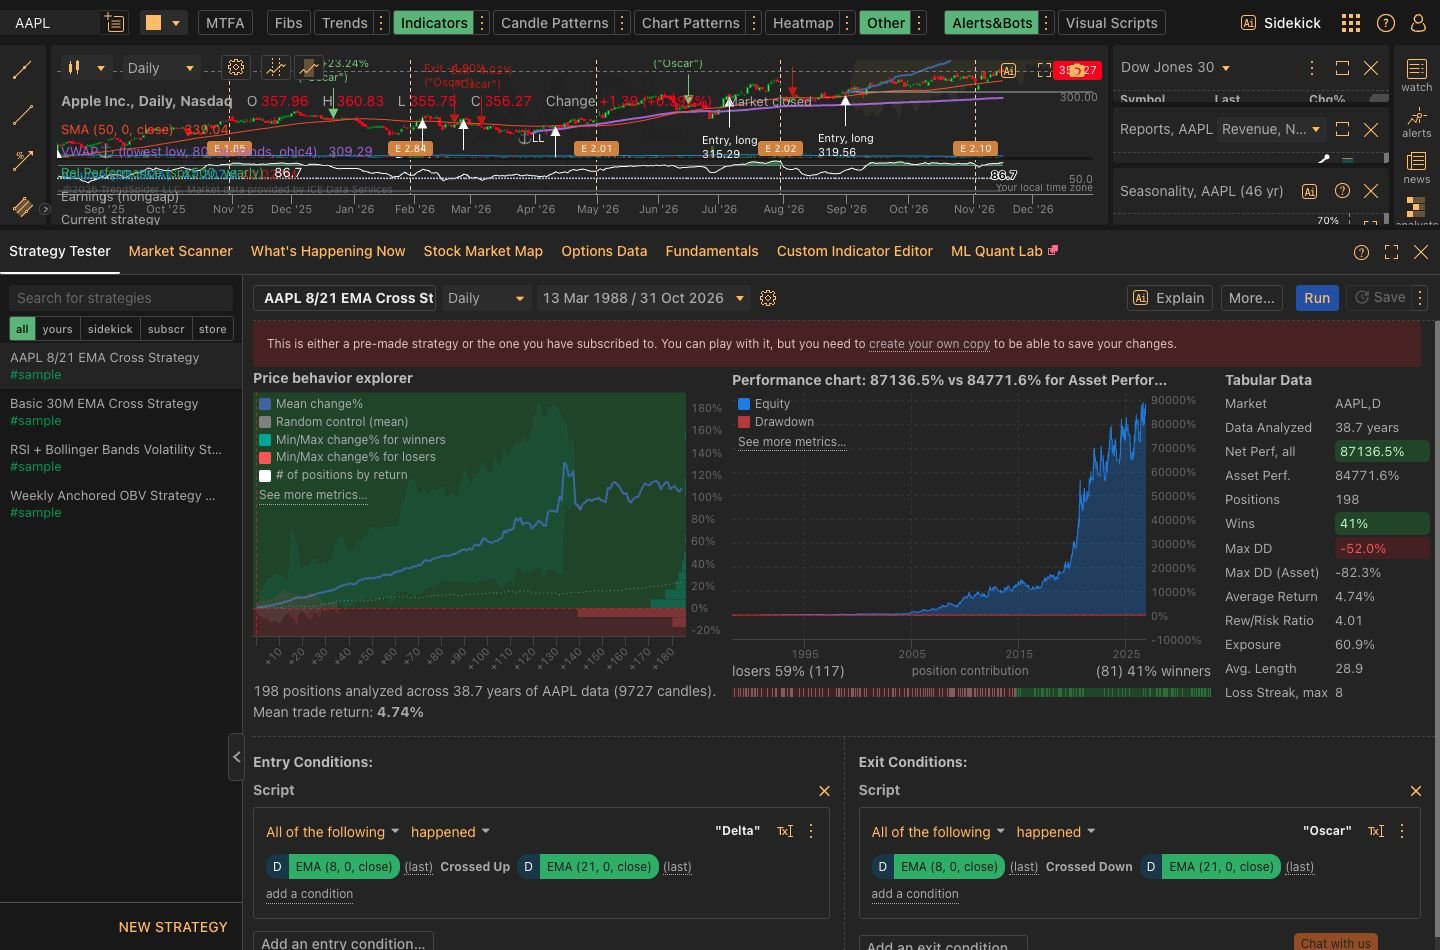
The tester displayed March 13, 1988 to October 31, 2026 as the selected range. When we edited the end date, the interface reset the start date. Check both fields and the range displayed above the results before comparing runs. A single-symbol simulation with zero modeled trading cost illustrates the interface. To assess the rule, compare against the same-period benchmark, rerun with realistic costs and check another period. Strategy Tester documentation.
TrendSpider vs TradingView
| What you do most | Where to start |
|---|---|
| Build recurring scans and check rules visually | Evaluate TrendSpider if you want visual builders for scanning, alerts and historical testing in one workspace. |
| Draw charts manually and explore community indicators | Start with TradingView. Check whether its charts, screeners and alerts cover what you already do. |
| Write or modify your own indicator code | Factor in the work you have already put into Pine Script and whether you need to rebuild those scripts elsewhere. |
| Run frequent intraday scans or tests | Compare the minimum timeframe and history depth for the specific plan you would pay for. |
The deciding question is whether the platform saves you time on a task you do every week. For a broader shortlist, see our TradingView alternatives comparison. For a look at TradingView’s subscription choices, see our TradingView pricing guide.
What to check before paying for TrendSpider
Compare plans using the limits that affect your workflow: minimum scanning and testing timeframe, number and duration of alerts, historical depth, and scheduled scans. If you use a daily setup, start by checking whether the lowest tier covers it. If you trade intraday, verify the exact timeframe and exchange feed you need before paying. Official plans and limits.
Frequently asked questions
Can I use TrendSpider without writing code?
You can configure the scanner and build the example strategy with the platform’s visual controls. Start with one condition and confirm that it behaves as expected before adding more.
Will a scan and a backtest give me the same results?
A scan evaluates conditions across a list at a particular time. A backtest simulates historical entries and exits using defined settings. Match the timeframe, data and session assumptions when comparing them.