The Bull Market Time
How much can the market sustain current price levels – as of now looks like forever…
We are within one of the biggest Bull-Markets of all times and assets continue to push forward although and despite everything.
If you will ask reporters like – Sue Chang from MarketWatch – some different point of view is heard – https://www.marketwatch.com/story/this-bull-market-may-soon-silence-all-the-naysayers-2018-08-21
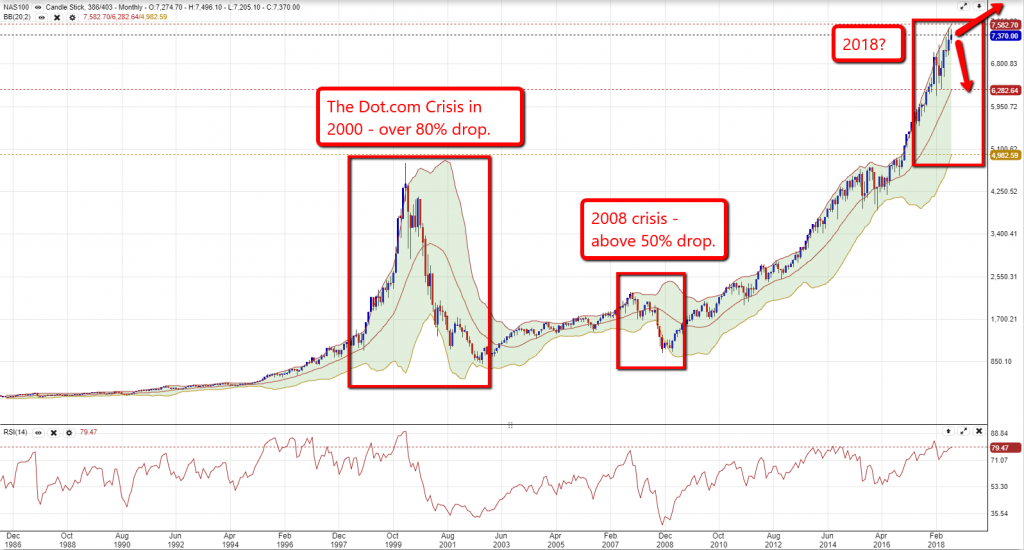
As assets behave lately stocks are pushing through everything and simply shake it off have a look at the Nasdaq and tell me what you think of an asset that behaves this way:
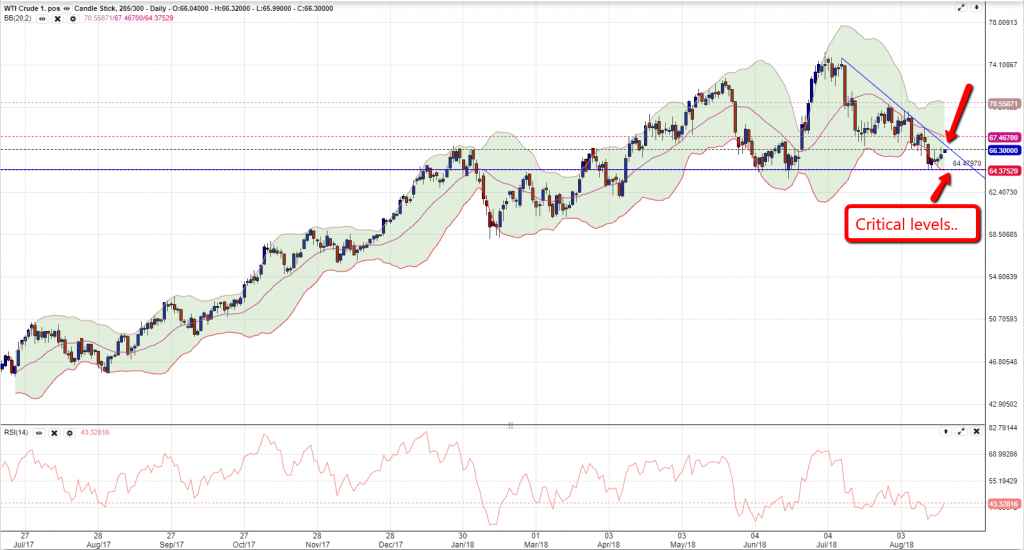
As Inventories will come in today – the Oil price is on a support level that creates a triangle which when is breached will lead to a continuation of a movement:
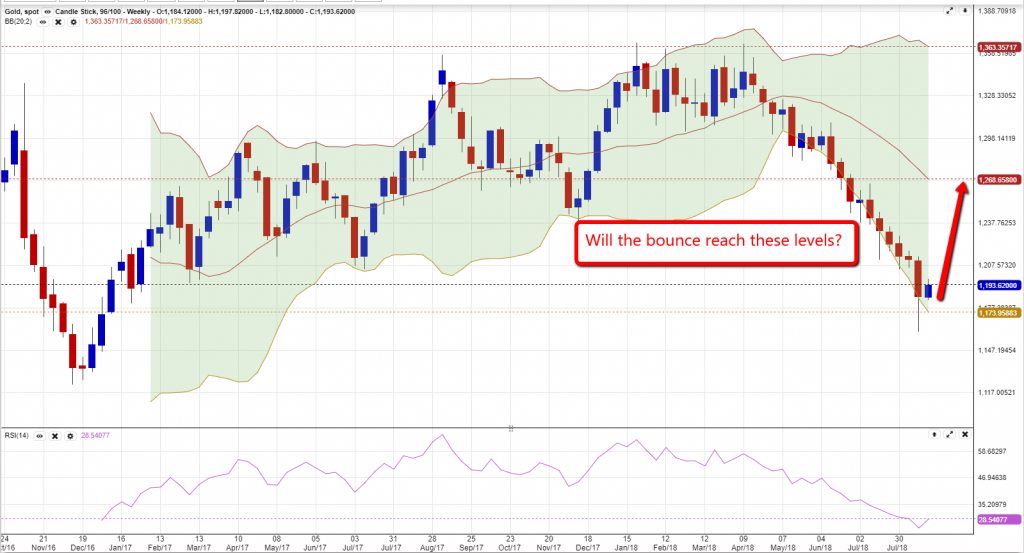
Last but not least – Gold – started a bounce of 35$ since he reached the bottom of 1,160 and by the Weekly chart should reach up till 1,268$ per ounce which gives a potential movement of 73$ movement…
Comment below and stay tuned – more to come…


