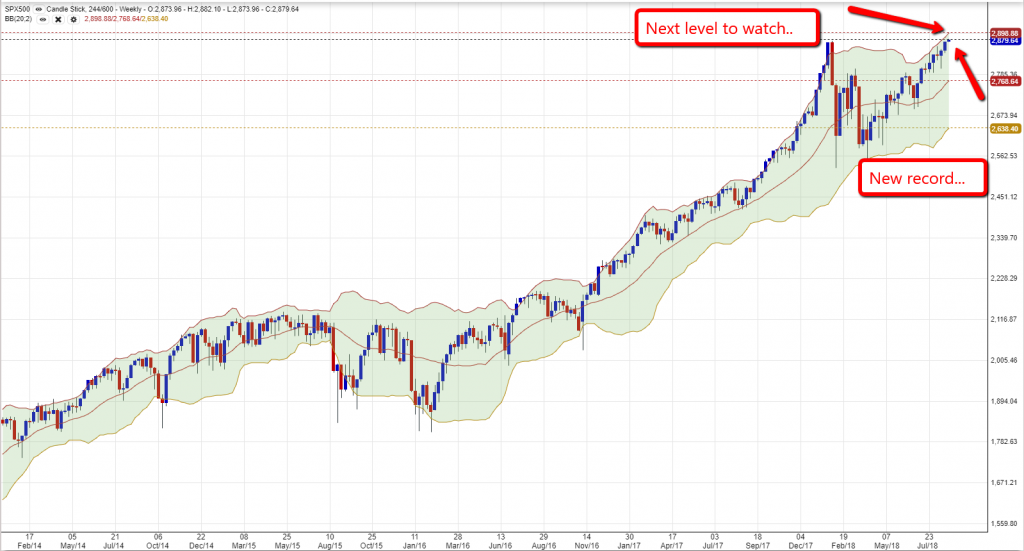
This is the longest Bull market in history – the longest!
Stocks have pushed through every barrier, and managed to change some perspective about long assumptions regarding the market such as miserable August(Coming up September/October – that historically are the worst months for stocks) – and managed to punish the bears – https://www.marketwatch.com/story/the-divergence-between-us-stock-performanceup-19-trillion-in-2018and-foreign-markets-may-make-investors-uneasy-2018-08-25
Are we going to see this lasting for long? how long can it last? how far can it go? – at this point a lot of investors are simply riding the wave and(still) don’t prepare for the worse…
Gold
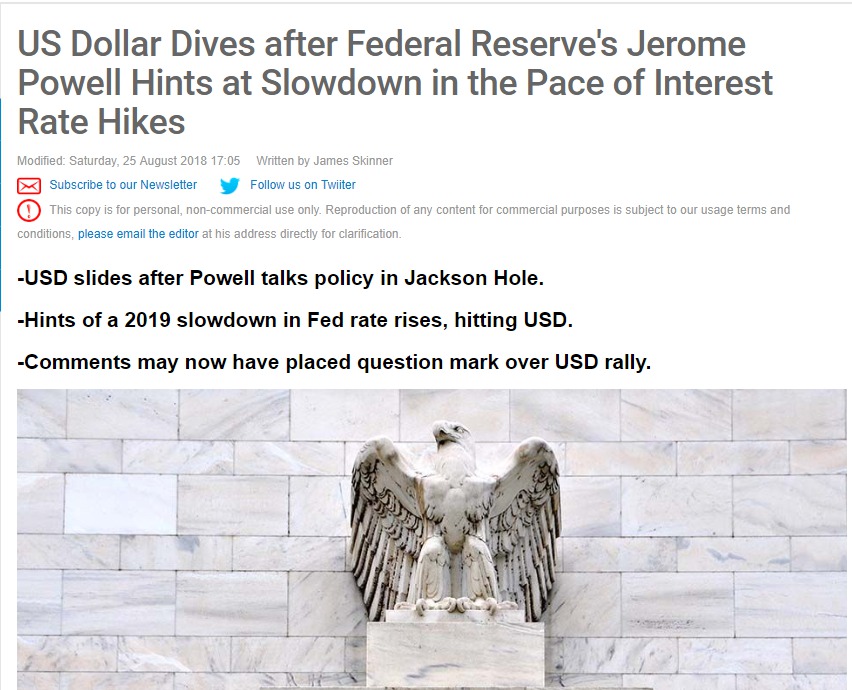
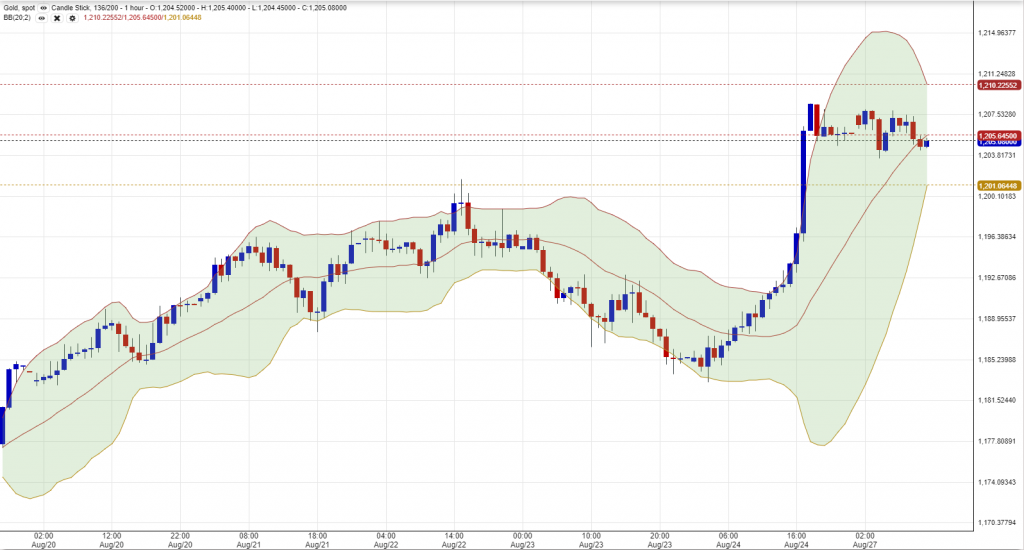
As the stocks market continues to push upwards – the Gold made an interesting movement on Friday, after Jerome Powell’s speech and a hint of a slowdown in the pace of interest rate hikes – https://www.poundsterlinglive.com/usd/9771-dollar-edges-lower-ahead-of-jerome-powell-s-jackson-hole-address-here-s-why-it-matters
Here is how the Gold responded after that speech…
If the dollar will continue to weaken, most likely the Gold will enjoy more upside, and levels of 1,238 are the levels to watch from if it will be breached, levels of 1,268 will occur very quickly.
Crude Oil
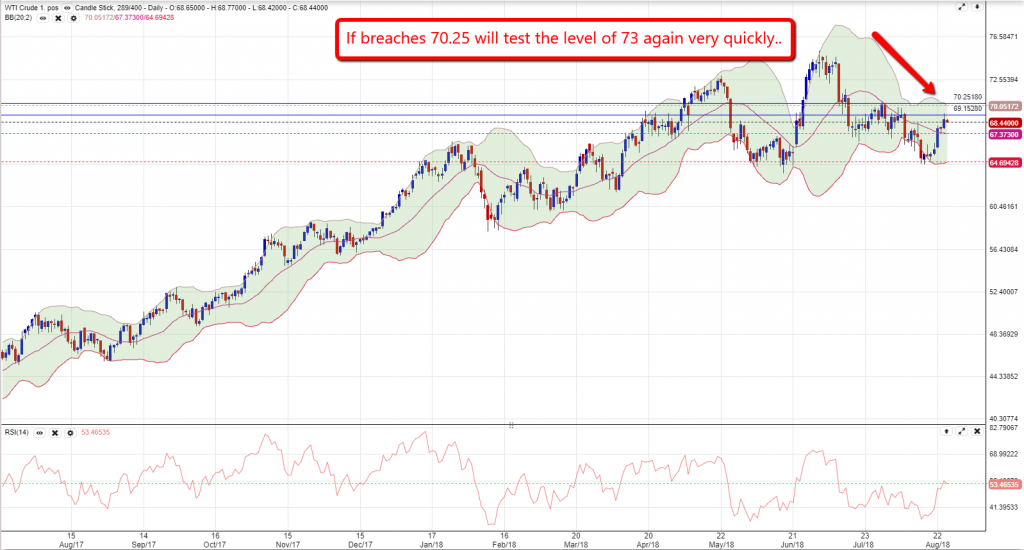
Another very interesting asset is the Crude Oil and his movement last week indicates that the “Black Gold” wants to push upwards, with a resistance range slightly changed after the price action last week and now shows that the next level to watch stands on 70.25 as the chart below will show you –
Comment below for more info and stay tuned…


