
Last verified: August 29, 2026
The best TradingView indicators for a beginner are not the most complicated or popular community scripts. They are simple, documented tools that answer different questions. A moving average can help describe trend direction, volume can show activity, and RSI can summarize recent momentum. None of them predicts the future, and stacking several indicators that measure similar data does not create independent confirmation.
Best Free TradingView Indicators for Beginners
For most beginners, the best free TradingView indicators are a moving average for trend context, Volume for market activity, and RSI for momentum. MACD can be useful later, but it overlaps with moving-average data and adds more signals to interpret.
| Indicator | Best used for | Main limitation |
|---|---|---|
| Moving Average | Broad trend context | Reacts after price changes |
| Volume | Comparing market activity | Does not predict direction |
| RSI | Reviewing recent momentum | Can stay high or low during strong trends |
| MACD | Observing changes in trend and momentum | Lags and can overlap with moving averages |
Quick starting point: Use one moving average plus either Volume or RSI. TradingView’s Basic plan currently allows two indicators per chart. Add another tool only when it answers a different question.
Important: This guide explains charting tools, not trading signals or personalized investment advice. Test every indicator on the correct market and timeframe, and understand its calculation before using it in a decision process.
How to Add Indicators to TradingView
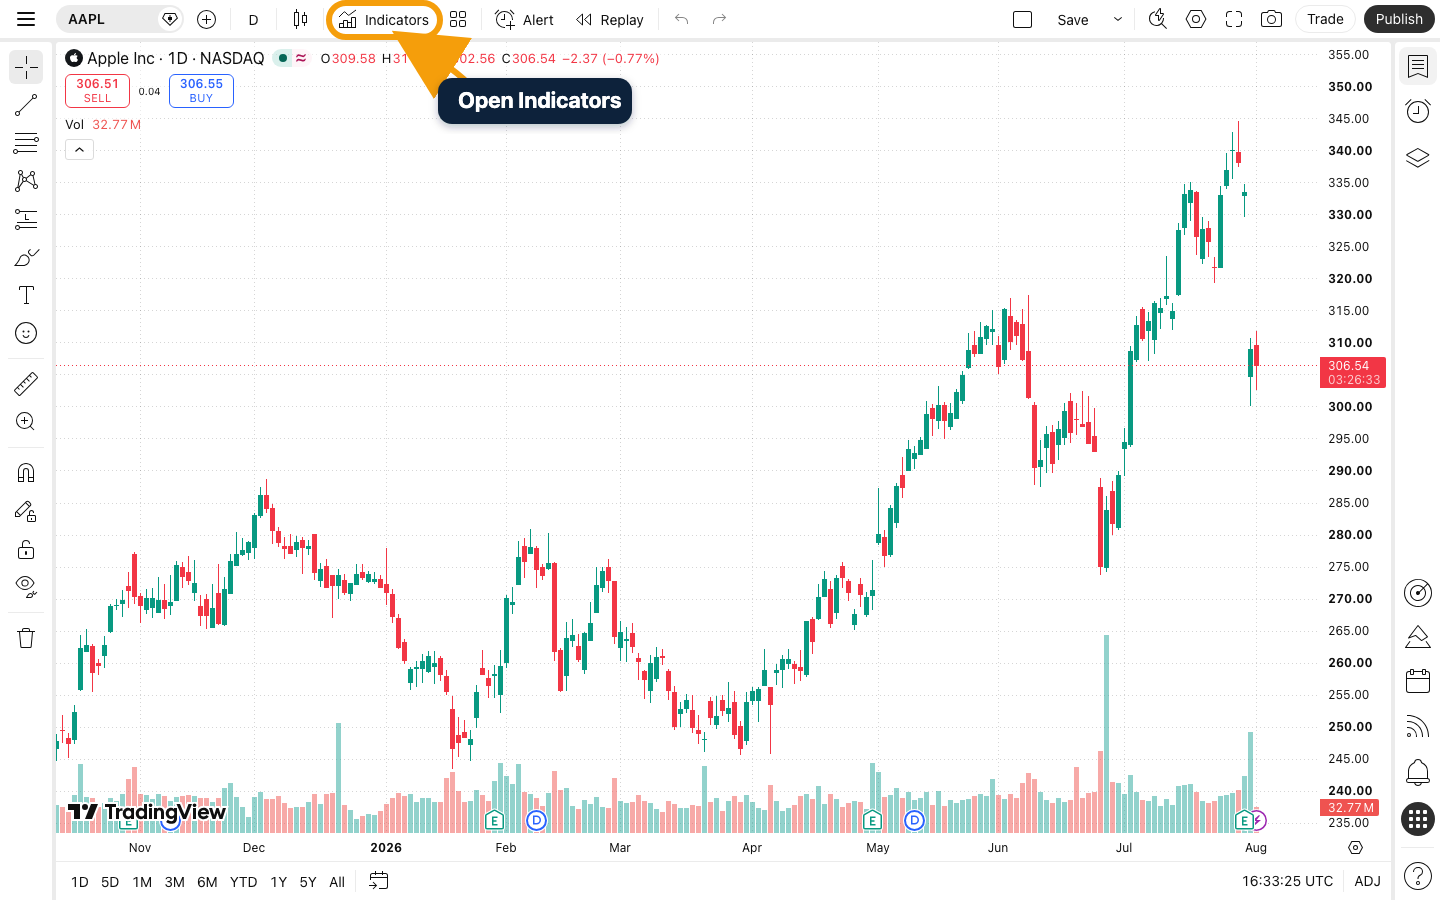
- Open TradingView Supercharts and confirm the correct symbol and timeframe.
- Select Indicators, metrics, and strategies in the top toolbar.
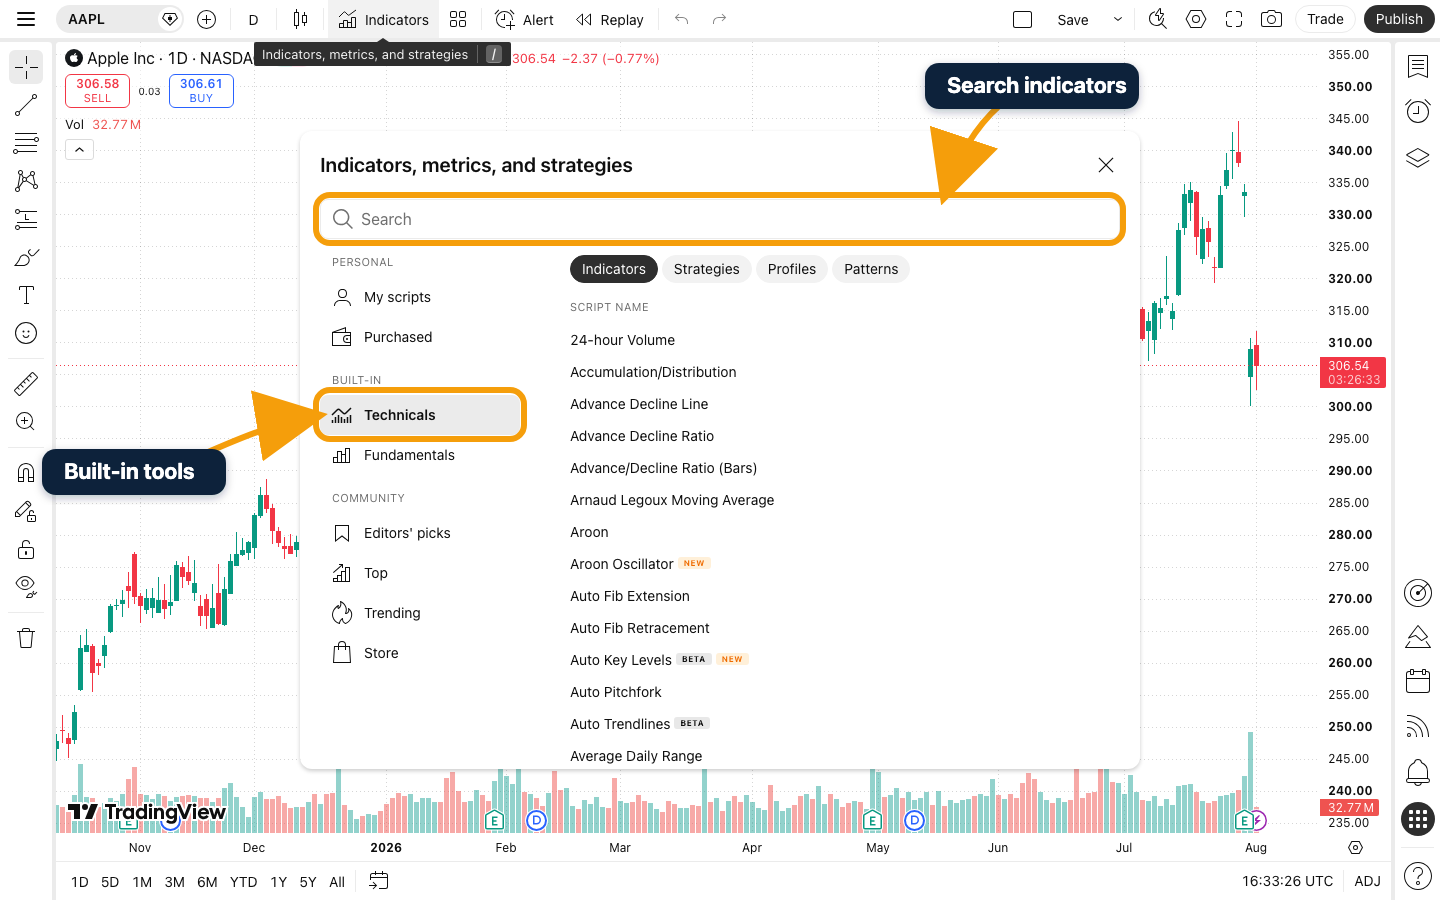
- Search for the indicator by name.
- Prefer the built-in version when you are learning the standard calculation.
- Select the indicator, close the menu, and open its settings from the chart.
- Change one input at a time and note why you changed it.
TradingView also hosts community scripts, invite-only scripts, and strategies. Popularity is not proof of validity. Check the author, source visibility, documentation, assumptions, repainting behavior, and test method before relying on any script.
1. Moving Average: A Simple View of Trend
A moving average plots an average of price data over a selected number of bars. TradingView describes moving averages as lagging or reactive indicators: they respond to events that have already happened rather than predicting what happens next.
Common versions include:
- Simple Moving Average (SMA): gives equal weight to each value in the selected period.
- Exponential Moving Average (EMA): gives more weight to recent values while older data continues to influence the calculation.
- Weighted Moving Average (WMA): assigns selected weights, with more significance commonly given to recent values.
A beginner can use one moving average to observe whether price has generally been above, below, or crossing the smoothed line. The result changes when the timeframe, source, length, or moving-average type changes. A crossover is not automatically a profitable entry because both price and the average can move repeatedly in sideways conditions.
Beginner question: Does this average make the broad direction easier to describe without hiding important price information?
2. Volume: Put Price Movement in Context
The built-in Volume indicator shows activity during each chart period. For stocks, TradingView explains volume in terms of shares traded; for futures, it is based on contracts. Other markets and data providers can use different volume definitions, including tick or provider-specific data.
Compare current activity with the recent history of the same symbol rather than using one universal threshold. A larger volume bar says activity increased; it does not by itself explain whether buyers or sellers will control the next move.
Before interpreting volume, check:
- What the selected data source reports as volume.
- Whether the chart includes regular, extended, or continuous sessions.
- Whether a contract rollover, corporate event, or unusual session affects the comparison.
- Whether you are comparing the same timeframe and recent history.
Beginner question: Is the current price movement happening with unusually high, normal, or low activity for this symbol?
3. RSI: A Bounded Momentum Measure
The Relative Strength Index is a momentum oscillator displayed between 0 and 100. TradingView’s built-in RSI uses 14 bars by default and describes the traditional 70 and 30 levels associated with overbought and oversold interpretations.
Those numbers are not automatic sell and buy instructions. A strong trend can keep RSI elevated or depressed for longer than expected. RSI also changes with the timeframe and length, so a daily RSI and five-minute RSI answer different questions.
Use RSI to study:
- How recent upward and downward momentum compare.
- Whether momentum behavior differs from an earlier part of the same market.
- How changing the calculation length affects sensitivity.
- Whether a proposed rule behaves consistently across a larger sample.
Beginner question: What does RSI add that is not already obvious from price, and does that interpretation remain consistent?
4. MACD: Trend and Momentum in One Panel
MACD compares exponential moving averages and displays a MACD line, signal line, and histogram. It can help visualize changes in trend and momentum, but it is derived from price and therefore remains a lagging tool.
MACD adds more moving parts than the first three indicators. Learn what each line represents before interpreting crosses or histogram changes. Avoid pairing MACD with several other moving-average indicators and describing every similar reading as separate confirmation.
Beginner question: Can you explain the MACD line, signal line, and histogram without relying on color alone?
A Clean Three-Indicator Beginner Setup
A simple learning chart can use:
- Price and one moving average in the main chart.
- Volume below price.
- RSI in a separate panel.
This is not a strategy. It is a workspace for asking three distinct questions about direction, activity, and momentum. Keep the default inputs initially, save the layout, and observe how each indicator behaves across trending, sideways, and unusually volatile periods.
| Question | Tool | What it cannot prove |
|---|---|---|
| What is the smoothed direction? | Moving average | Where price must go next. |
| How much activity occurred? | Volume | Who will control the next period. |
| How strong was recent directional momentum? | RSI | That a reversal is imminent. |
The Basic plan currently lists two indicators per chart, so the complete three-indicator setup may require removing one tool, using a combined script you have carefully verified, or comparing current paid limits. See our TradingView pricing guide.
Which TradingView Indicator Should a Beginner Choose?
Choose an indicator based on the question you want the chart to answer:
- Need broad trend context? Start with one moving average.
- Need to compare activity? Add Volume and compare it with the recent history of the same symbol.
- Need a bounded momentum reading? Study RSI, while remembering that 70 and 30 are not automatic trade signals.
- Need a combined trend and momentum view? Learn MACD after you understand its lines and histogram.
Start with one question and one tool. Add a second indicator only when it contributes different information. If you want the platform to notify you when a condition is met, continue with our TradingView alerts guide.
How to Compare Indicators Properly
- Keep the symbol, timeframe, chart type, and date range unchanged.
- Add only one new indicator or change one input.
- Write down what information the tool is supposed to provide.
- Observe several different market conditions, not only a selected example where it looks accurate.
- Record false, late, and conflicting readings as well as useful ones.
- Use Paper Trading for process practice without risking money.
Common TradingView Indicator Mistakes
- Indicator stacking: several price-derived tools can repeat the same information.
- Changing inputs to fit the past: a perfect historical example can be overfitted.
- Ignoring the timeframe: the same indicator can behave differently on each interval.
- Using the wrong data source: verify the exchange and symbol before evaluating a signal.
- Treating thresholds as commands: RSI 70 or 30 does not force an immediate reversal.
- Trusting community scripts blindly: popularity, branding, and backtest screenshots are not independent verification.
- Ignoring repainting: understand whether a script can change earlier values as new information arrives.
New to the interface? Begin with our complete TradingView beginner’s guide.
Affiliate note: We may earn a commission from qualifying TradingView purchases made through our links, at no extra cost to you.
